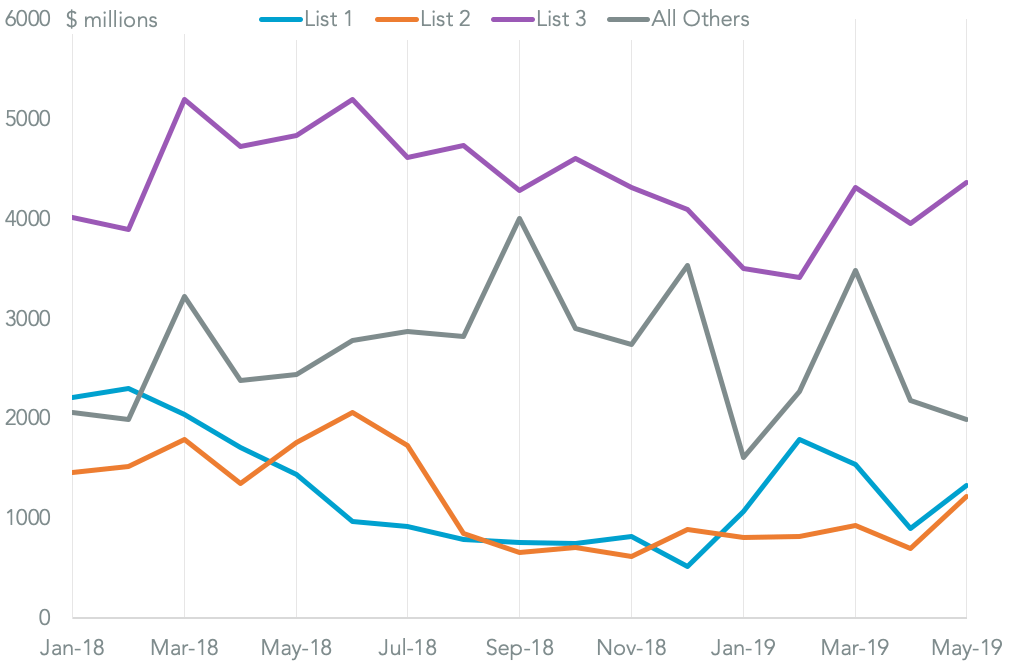
The pressure on U.S. exports resulting from Chinese tariffs eased slightly in May. Panjiva analysis shows that exports of products that have been targeted for tariffs increased by 24.5% sequentially in May compared to April. That was led by a 74.1% surge in exports of so-called “list 2” items where 25% duties were applied in Aug. 2018.

Chart segments U.S. exports to China on the basis of tariffs applied since Jul. 2018. Source: Panjiva
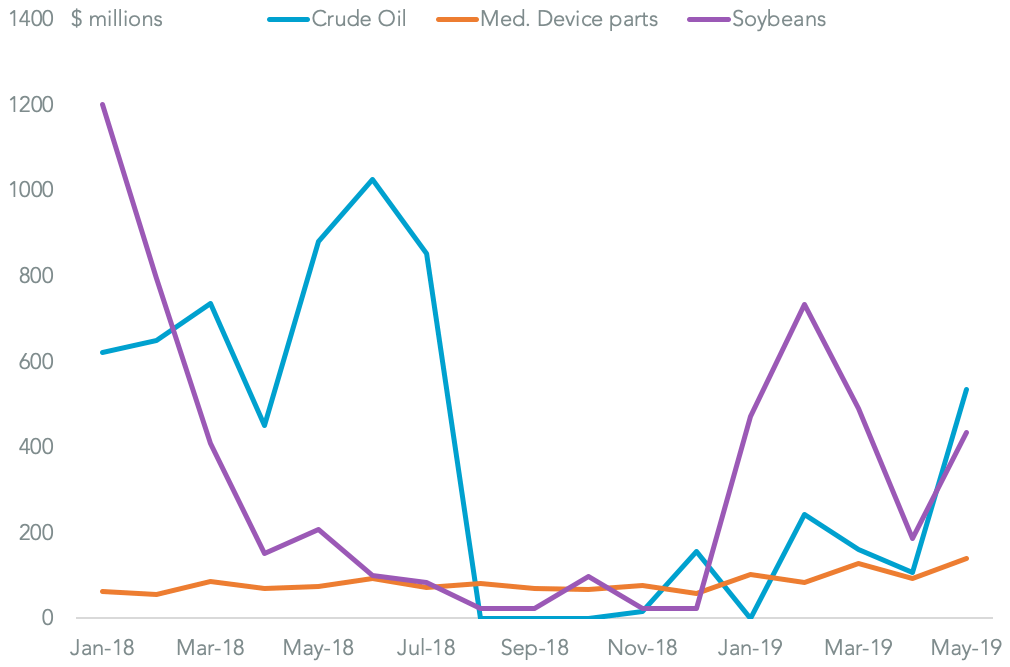
In turn that was largely the result of a 5.0x surge in the exports of crude oil compared to a month earlier to the highest level since tariffs were applied, Panjiva data shows. Among other list 2 items there was also a 1.5x increase in the exports of parts for medical devices. There was also a 1.7x jump in the export of soybeans. In context though the exports worth $434 million in May were only a little above the $322 million average in the prior six months.
Further increases in exports of agricultural are likely given the focus of the sector in the recent agreement reached by President Donald Trump and President Xi Jinping to restart trade talks, as outlined in Panjiva’s research of July 1.
It’s not all good news, of course, given that overall exports of products targeted for tariffs fell 13.9% year over year in May.
MAY REBOUND DRIVEN BY STATE-OWNED ENTERPRISE PURCHASES

Chart segments U.S. exports to China by product for crude oil, medical device parts and soybeans. Source: Panjiva
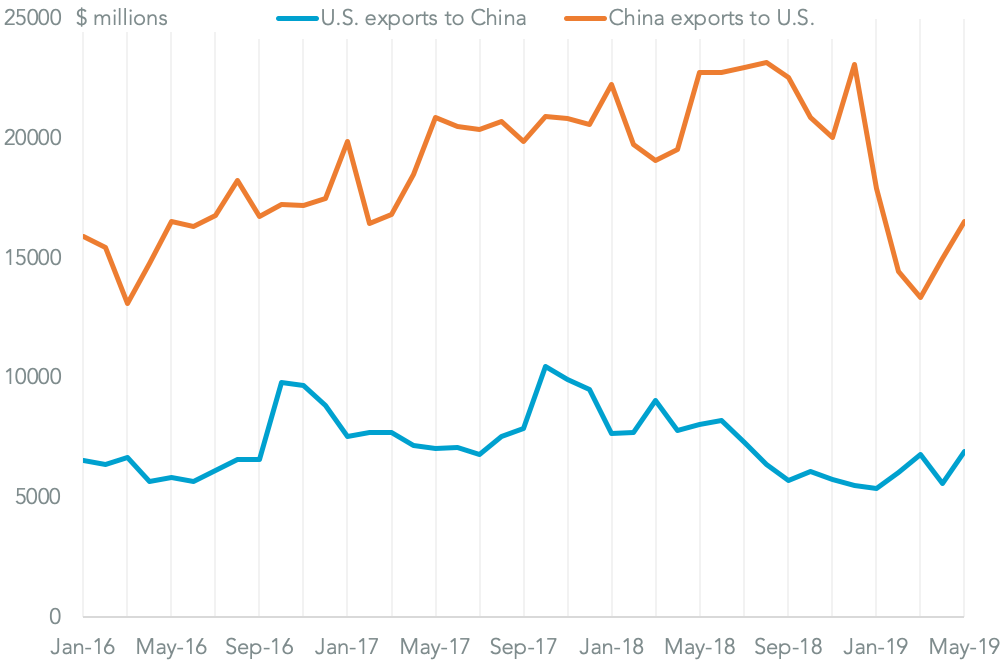
Chinese exporters meanwhile saw a similar phenomenon with a 13.2% increase in shipments of “list 3” products where 10% duties were applied in Sept. 2018. However in that instance the increase was the result of a surge in shipments to get ahead of an increase in those duties to 25%.
The most significant sequential increase came for telecoms network equipment with a 16.6% increase while furniture shipments surged by as much as 46.5% sequentially for wooden household items.
CHINA EXPORT BOUNCE IN MAY DRIVEN BY TARIFF INCREASE RUSH

Chart compares U.S. exports covered by Chinese duties applied since Jul. 2018 to Chinese exports to the U.S. covered by tariffs over the same period. Source: Panjiva
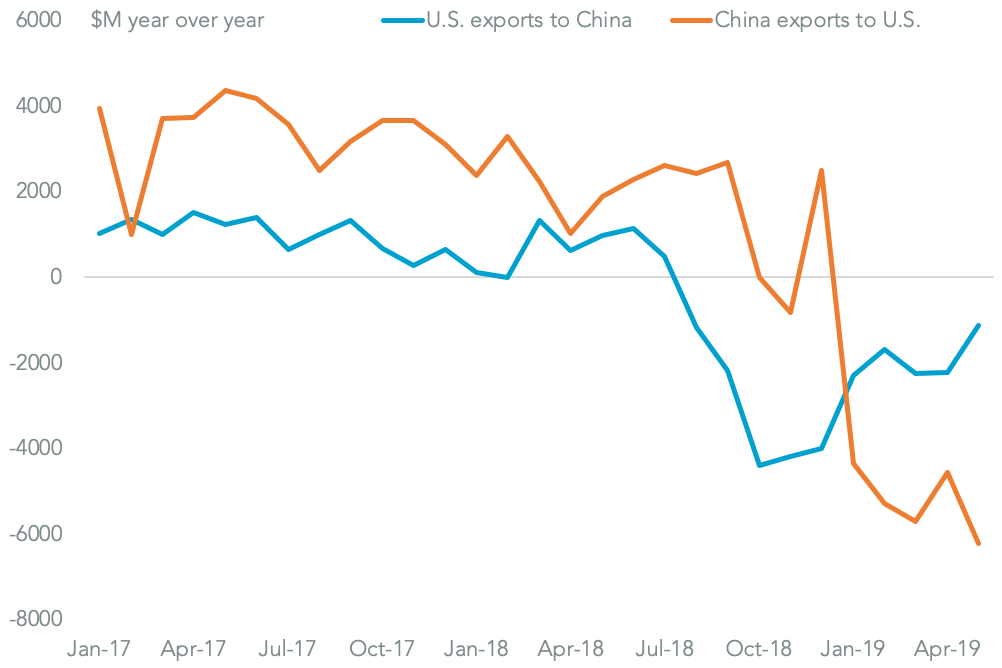
Also similarly to U.S. exporters’ position there was a marked year over year drop of 27.4% in all Chinese exports of products where tariffs were applied. Not only did Chinese exporters “lose” in absolute terms they also lost out in absolute terms – U.S. exports fell $1.11 billion while China’s dropped $6.22 billion.
Given the tariff pressure is working in inflicting more damage on Chinese exports rather than America’s it’s likely the Trump administration will continue to maintain the tariffs as long as possible. That’s likely the reason that China’s Commerce Ministry has indicated a deal won’t be completed without the complete removal of tariffs.
In aggregate of course both sides have lost, with bilateral trade in the Jul. 2018 to May 31 2019 period down by $41.1 billion compared to a year earlier for products where tariffs have been applied.
CHINA LOSES MORE, BUT LATER, THAN THE U.S. FROM TRADE WAR

Chart segments year over year change U.S. exports covered by Chinese duties applied since Jul. 2018 to Chinese exports to the U.S. covered by tariffs over the same period. Source: Panjiva


