
U.S. total trade activity fell 0.4% year over year in June, Panjiva analysis of official data shows. That compares to a 1.2% improvement in May. The main drag came from exports which fell 2.2%, including a 3.5% slide in goods exports. As discussed in Panjiva’s research of July 25 that was mostly down to a decline in food and in capital goods where the impact of the trade war with China is being felt.
Total imports meanwhile increased by 1.2%, including a small rise in the imports of goods of 0.3%, though services increased by a more significant 5.1%. That resulted in a trade deficit of $55.2 billion in total, including a goods deficit of $75.1 billion. Both have now increased for four straight months, and represent a “worse” result in terms of the Trump administration’s preferred trade policy metric.
GOODS TRADE SLOWING, ESPECIALLY EXPORTS
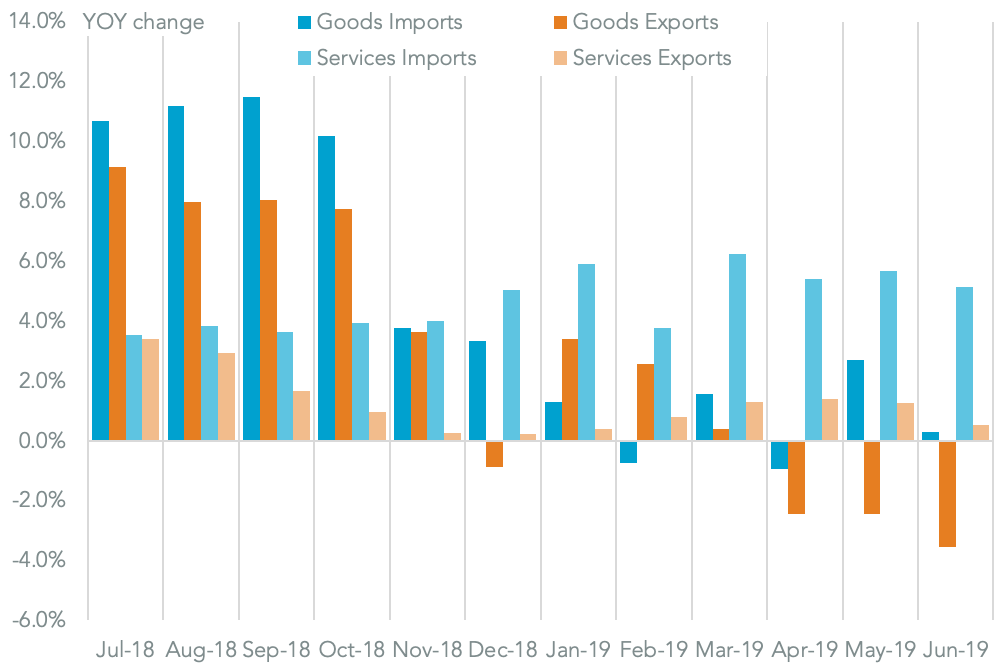
Chart segments change in U.S. trade by direction and goods versus services. Calculations based on U.S. Census Bureau data. Source: Panjiva
Trade with China was the biggest drag on overall trade activity with U.S. exports to China falling 16.8% year over year in June. That was a somewhat slower rate of decline compared to the 18.4% of the prior three months to May 31. Imports from China meanwhile fell 12.6% in June and by 12.7% in the prior three months.
While that would suggest that China is “winning” in percentage terms, in dollar terms U.S. exports only fell by $1.82 billion in June while imports fell $5.61 billion. Taking the past 12 months in total – the first round of tariffs were applied in July 2018 – U.S. exports have fallen by $27.0 billion while imports have declined by $16.7 billion.
The “success” of tariff pressure in reducing Chinese exports more than U.S. exports will likely only increase the likelihood that President Trump proceeds with his threat from Aug. 1 to increase tariffs to cover effectively all Chinese exports from September 1.
WINNING OR LOSING IS A MATTER OF PERSPECTIVE
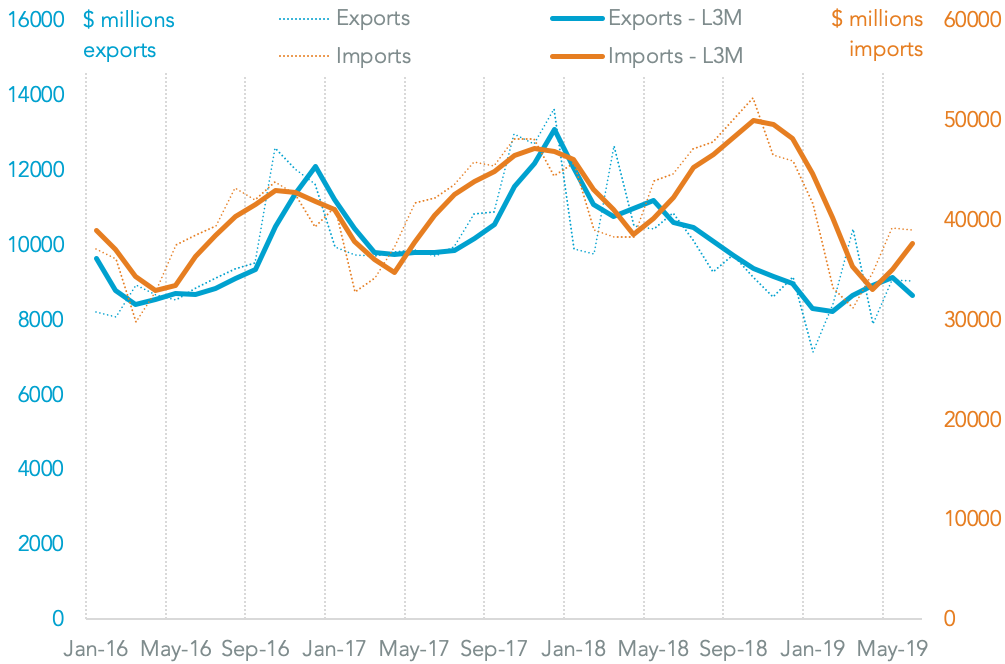
Chart compares U.S. exports to China (blue, right hand axis) to imports from China (orange, right hand axis). Calculations based on U.S. Census Bureau data. Source: Panjiva
The impact of tariffs has been fairly clear cut. Panjiva analysis shows that, in June, imports of List one tariffs (where duties of 25% were applied in July 2019) there was a 38.3% year over year decline. List two, where duties were applied at 25% in August 2019, fell 33.8%.
List three products, where duties of 10% were applied in September and increased to 25% in May, fell 32.6%. It’s worth noting there was a bump in imports of list three products in December in anticipation of a tariff increase that didn’t actually arrive.
List four products – where tariffs have yet to be applied and will be defined by September 1 – increased by 12.6% year over year. The latter followed a 12.6% increase in May and 8.7% in April potentially reflecting (a) continued strength in consumer spending but more likely (b) a degree of stockpiling / earlier peak season shipping to get ahead of tariffs given the earlier breakdown in talks in May.
THE USUAL STOCKPILING STORY STARTING FOR LIST FOUR
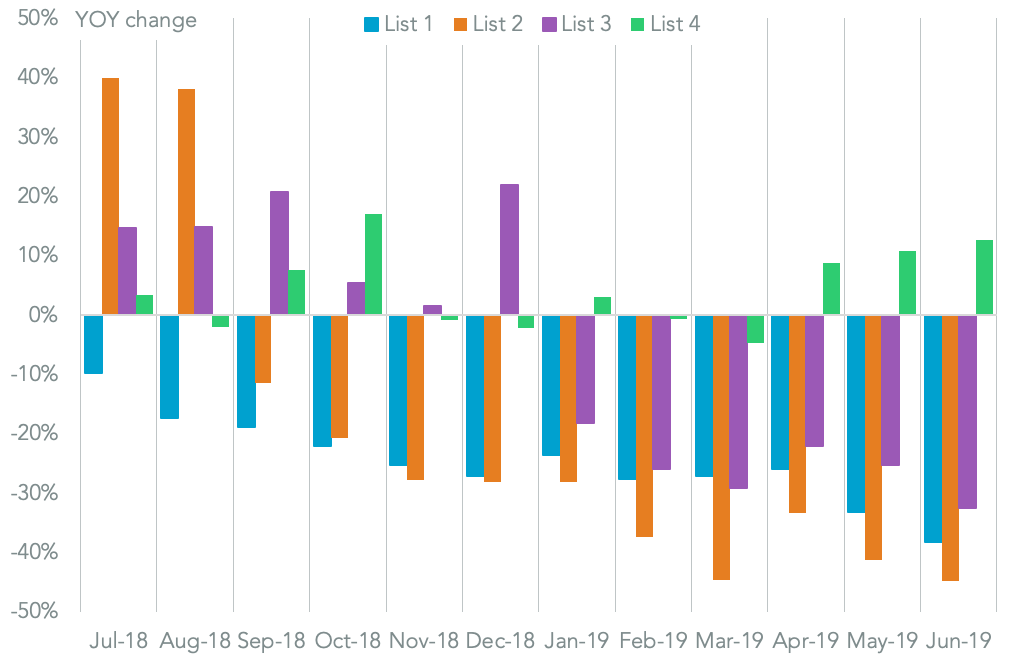
Chart segments change in U.S. imports from China based on tariff list category. Source: Panjiva
In many regards the true impact of tariffs on Chinese exports is only just beginning to become clear given the 25% duties on list 1 / 2 products only cover $37.5 billion of U.S. imports in the 12 months to Jun. 30.
The list three products were worth $187.3 billion over the same period having had 10% duties since September and 25% since May, while list 4 products worth $281 billion have yet to actually have tariffs applied at all.
THE WORST IS YET TO COME
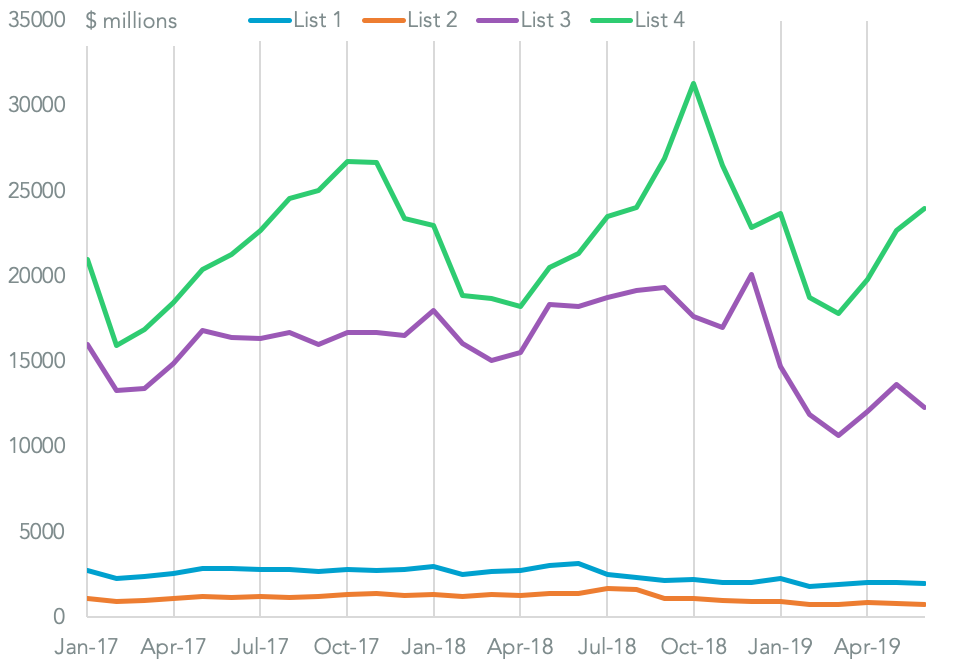
Chart segments U.S. imports from China based on tariff list category. Source: Panjiva