
Fresh off eligibility clarifications from the IRS and just-published 2022 US unemployment data, revisited energy community criteria under the Inflation Reduction Act of 2022 show hundreds of counties and thousands of census tracts likely qualifying, with more than a third of planned US renewable projects to be based in those footprints.
In an April 4 notice, the IRS expounded on the Inflation Reduction Act's qualifying energy community criteria for 10% tax credit adders, notably issuing guidance on fossil fuel employment eligibility. Based on these clarifications, and resulting adjusted footprints, S&P Global Commodity Insights estimates that 36.1% of planned US renewable projects — battery storage, biomass, geothermal, solar and wind — will be sited in a qualifying geography.
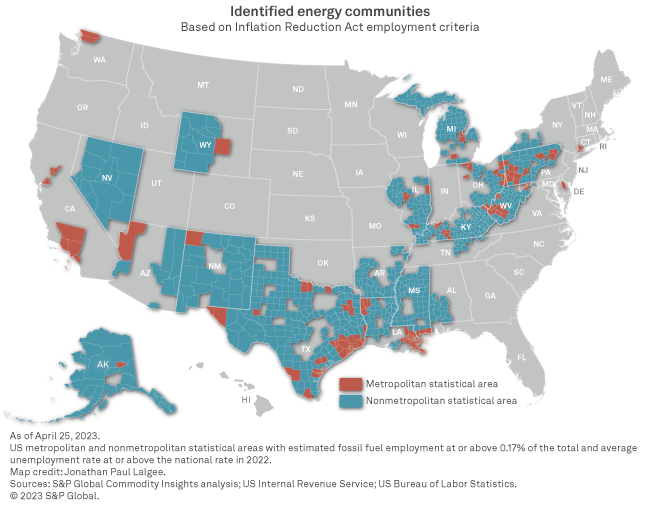
Along with its notice, the IRS published a list of 178 metropolitan and nonmetropolitan statistical areas (MSAs and non-MSAs) consisting of more than 1,500 unique counties or county-equivalent meeting the 0.17% fossil fuel employment threshold, on which Commodity Insights overlaid an unemployment analysis based on 2022 labor data the US Bureau of Labor Statistics released April 21.
Overall, 97 MSAs and non-MSAs made up of 838 unique counties and county-equivalents combined fossil fuel employment accounting for at least 0.17% of the total at any time after Dec. 31, 2009, and an unemployment rate above the national average in 2022 based on our study.
Texas is home to the largest amount of identified counties, accounting for a calculated 24.2% of the total. Kentucky is a distant second at 11.2%. Mississippi rounds out the top three with an 8.1% share. Alaska ranks 11th, but the 28 identified Alaskan counties or county-equivalents encompass most of the Last Frontier State — by far the largest in the union with an area of more than 663,260 square miles, or nearly 2.5 times the size of Texas.
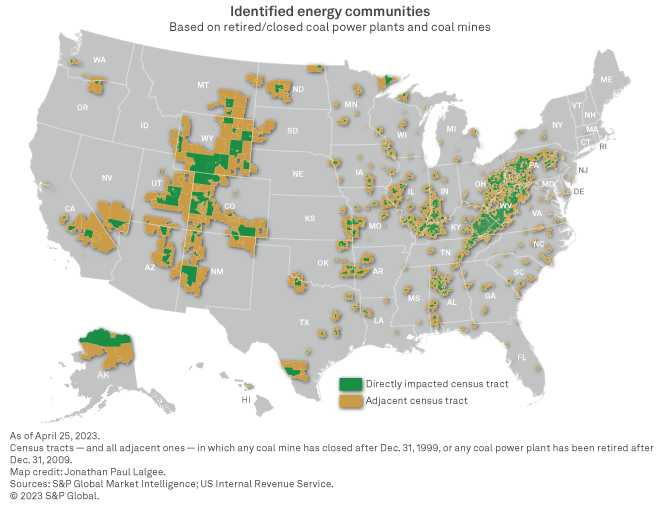
According to the IRS, more than 4,150 census tracts across 45 states and the District of Columbia qualify as energy communities based on the Inflation Reduction Act's retired coal power plant/closed coal mine criterium. Perhaps unsurprisingly, states across or bordering the Appalachian Mountain range, of which large swaths historically have been called "coal country," overwhelmingly dominate the identified census block footprint.
At the northern tip of the Appalachian Mountain, Pennsylvania tops the charts of states with census tracts qualifying as energy communities under the Inflation Reduction Act, with 15.4% of the identified total. Fellow Appalachian region states Kentucky, Ohio and West Virginia rank second, third and fourth, respectively.
With Illinois ranking fifth and Indiana ranking sixth, the top six states by eligible census tracts essentially delineate the "Rust Belt." Once the engine of the US economy — arguably an industrial version of today's Silicon Valley — the region has suffered from decades of decline in the share of manufacturing in the US gross domestic product, a trend the Inflation Reduction Act in part is designed to help reverse through the law's energy community special rule.
Qualifying energy communities per the Inflation Reduction Act of 2022:
– Census tracts, and all adjacent ones, in which any coal mine has closed after Dec. 31, 1999, or in which any coal power plant has been retired after Dec. 31, 2009.
– Metropolitan and nonmetropolitan statistical areas where, after Dec. 31, 2009, fossil fuel occupations have accounted for at least 0.17% of direct employment or contributed 25% of local tax revenues and where the unemployment rate is at or above the national average for the previous year.
– Brownfield sites — broadly, land where the presence or potential presence of pollutants, contaminants or hazardous substances impedes development.
Jonathan Paul Lalgee and Chris Allen Villanueva contributed to this article.
For wholesale prices and supply and demand projections, see the S&P Global Market Intelligence Power Forecast.
Regulatory Research Associates is a group within S&P Global Commodity Insights.
S&P Global Commodity Insights produces content for distribution on S&P Capital IQ Pro.
This article was published by S&P Global Market Intelligence and not by S&P Global Ratings, which is a separately managed division of S&P Global.