
Trade concerns are weighing more heavily on industrial decision making in the U.S. The latest ISM survey shows export expectations at 48.1 from 50.5 a month earlier, where a figure below 50 indicates contraction. That’s the worst result since February 2016 when the last global trade downturn was ending in the wake of China’s economic mini-slowdown.
Trade reportedly “remains a significant issue” with “more respondents (noting) supply chain adjustments” according to the ISM. That matches with experience from company conference calls where tariffs are increasingly seen as a way of life, as discussed in Panjiva’s research of July 24.
The growing pessimism and supply chain realignments may accelerate later in the fall as a result of the Trump administration’s latest move to increase the range of tariffs on Chinese exports from September 1. The move to negative export expectations means the U.S. joins China and Germany in similar positions.
COORDINATED DOWNTURN FROM BIG THREE EXPORT ECONOMIES
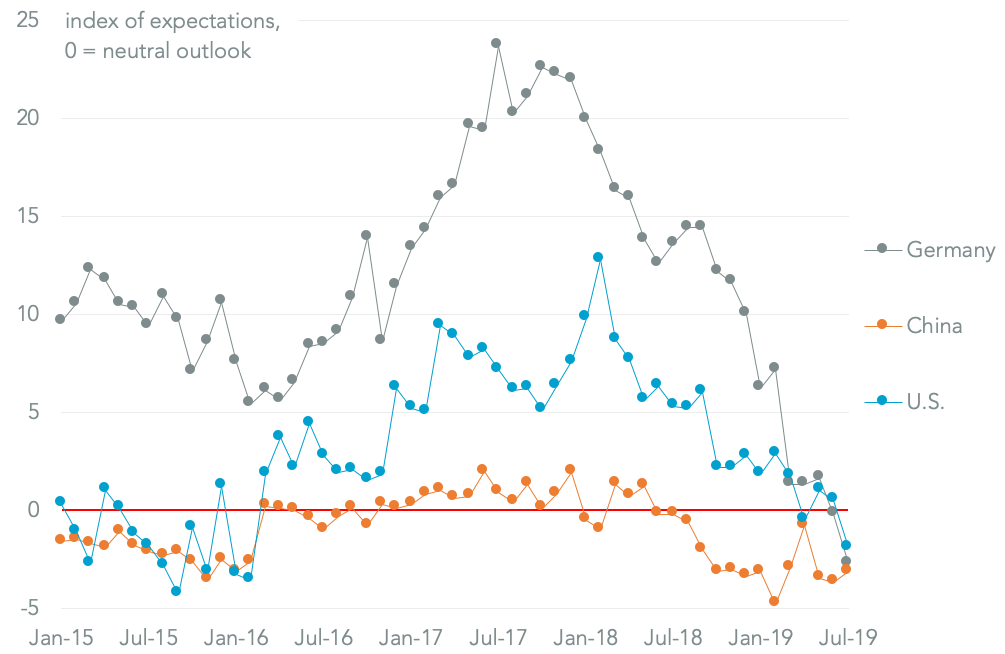
Chart compares export order expectations by country of survey, rebased to zero = neutral outlook. Calculations based on data from ISM, IFO and CFLP surveys. Source: Panjiva
Importantly it also comes amid a darkening of the export picture globally. Panjiva analysis of S&P Global Market Intelligence data shows 20 out of 24 countries that have reported June data have shown a year-over-year decline in exports. The arithmetic average of the 24 countries shows a 7.7% decline compared to a year earlier.
That compares to 21 out of 37 countries that saw a downturn in May when a technical trade recession began with exports down year over year for two consecutive three month period.
EXPORT DOWNTURN WIDENING AND DEEPENING
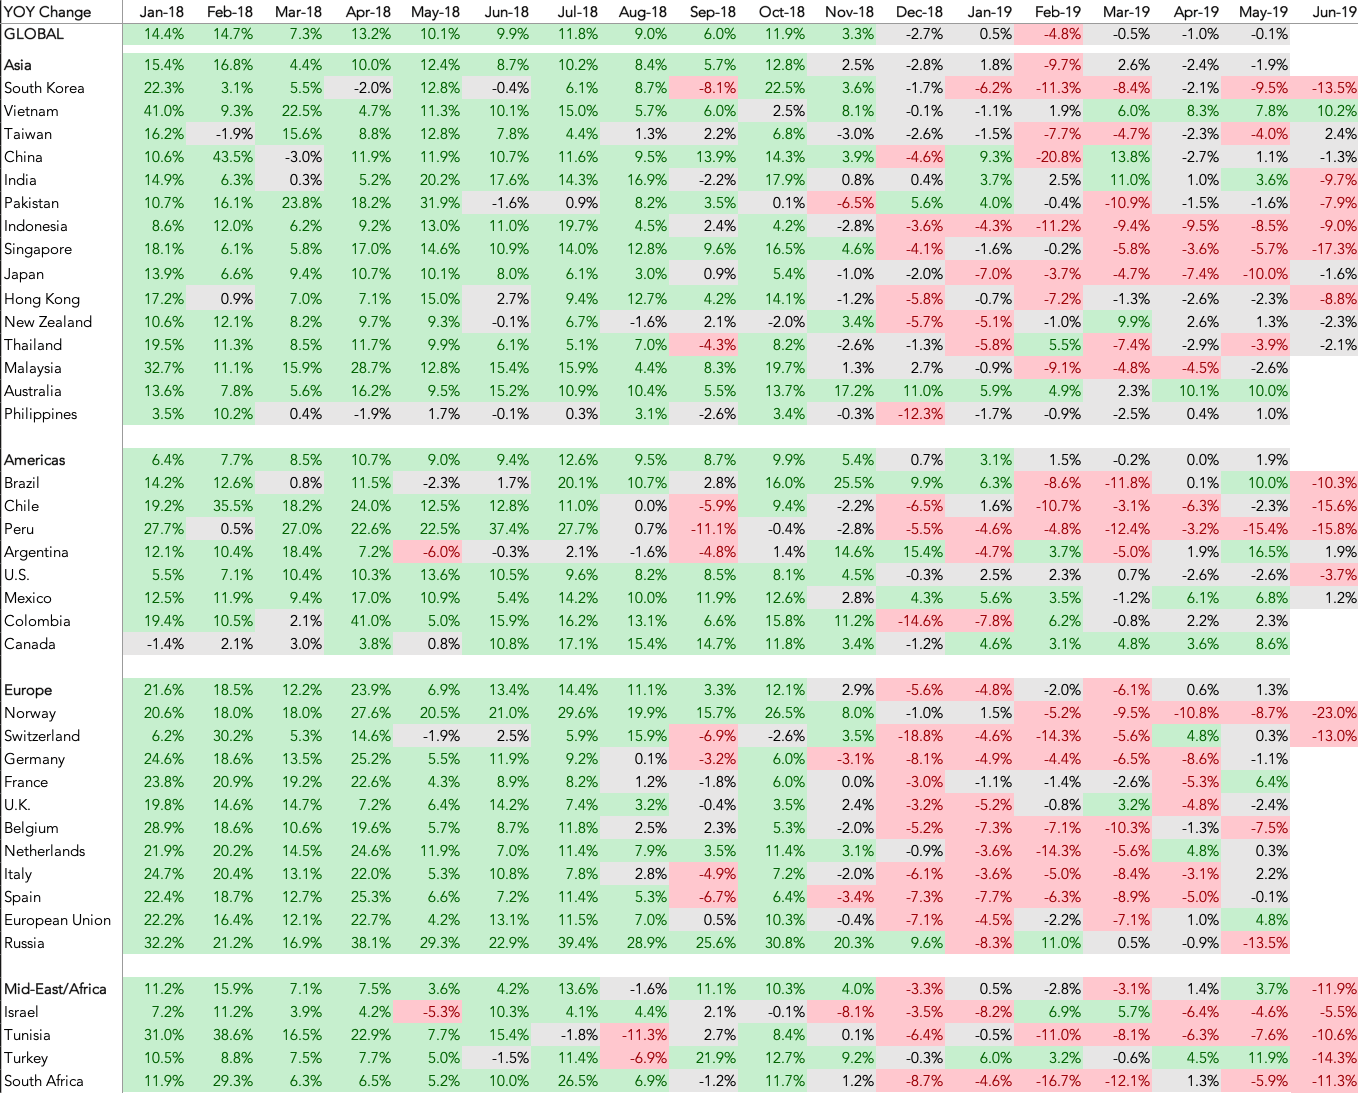
Chart compares year over year change in exports by origin. Calculations based on S&P Global Market Intelligence data. Source: Panjiva