
U.S. international trade activity fell 3.3% year over year in October, Panjiva’s analysis of official data shows. That was the second straight monthly decline and represented the fastest fall since May 2016. Merchandise activity led the way with a 5.5% slide, while services continued expanding with a 3.6% growth rate.
The drop in goods imports of 6.6% was faster than the slip in exports of 3.7% for the third month. As a consequence the Trump administration’s key trade metric – the trade deficit – fell 7.6% to $47.2 billion. While the year-over-year fall represents policy success on those terms, it is still the second highest deficit for the month of October since 2008.
GOODS IMPORT DECLINE, SERVICES EXPORTS EXPANSION BOTH ACCELERATING
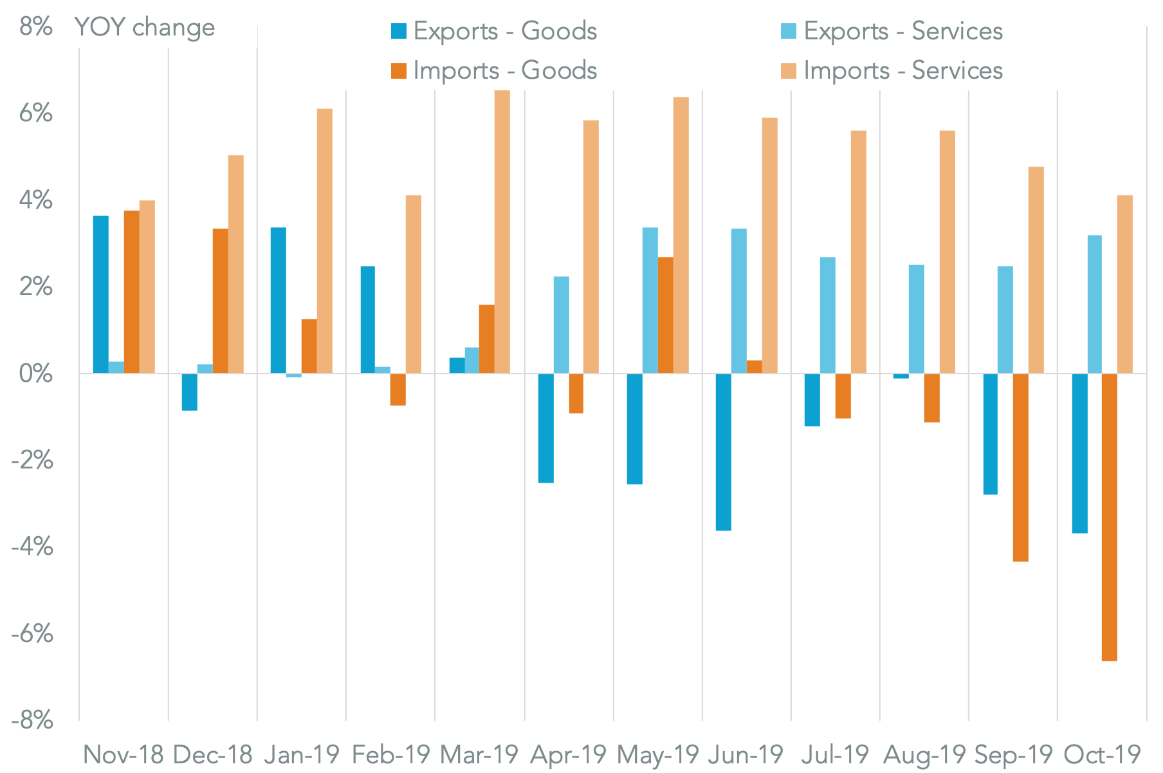
Chart segments change in U.S. trade activity by direction. Calculations based on U.S. Census Bureau data. Source: Panjiva
All eyes of course are on the performance of trade with China where phase one trade deal talks appear to be struggling. Panjiva data shows U.S. imports from China continued to crater with a slump of 23.1% year over year.
Yet, exports only declined by 2.8% suggesting U.S. tariff pressure is proving more effective than China’s measures. The more robust export result was largely down to a 5.5x expansion in shipments of soybeans. Excluding that one item would have seen exports drop by 8.7% year over year.
There was also a 145% jump in shipment of mid-size engined cars – where tariffs had previously been relaxed. A 41.6% surge in shipments of electronic circuits may reflect concerns about the advent of technology export restrictions – electronics production being just-in-time in nature.
The largest declining export line was aircraft, where there was a 72.2% drop which offset all the gains from soybeans, cars and circuits.
CHINA’S NOT THE ONLY REASON FOR U.S. IMPORT CONTRACTION
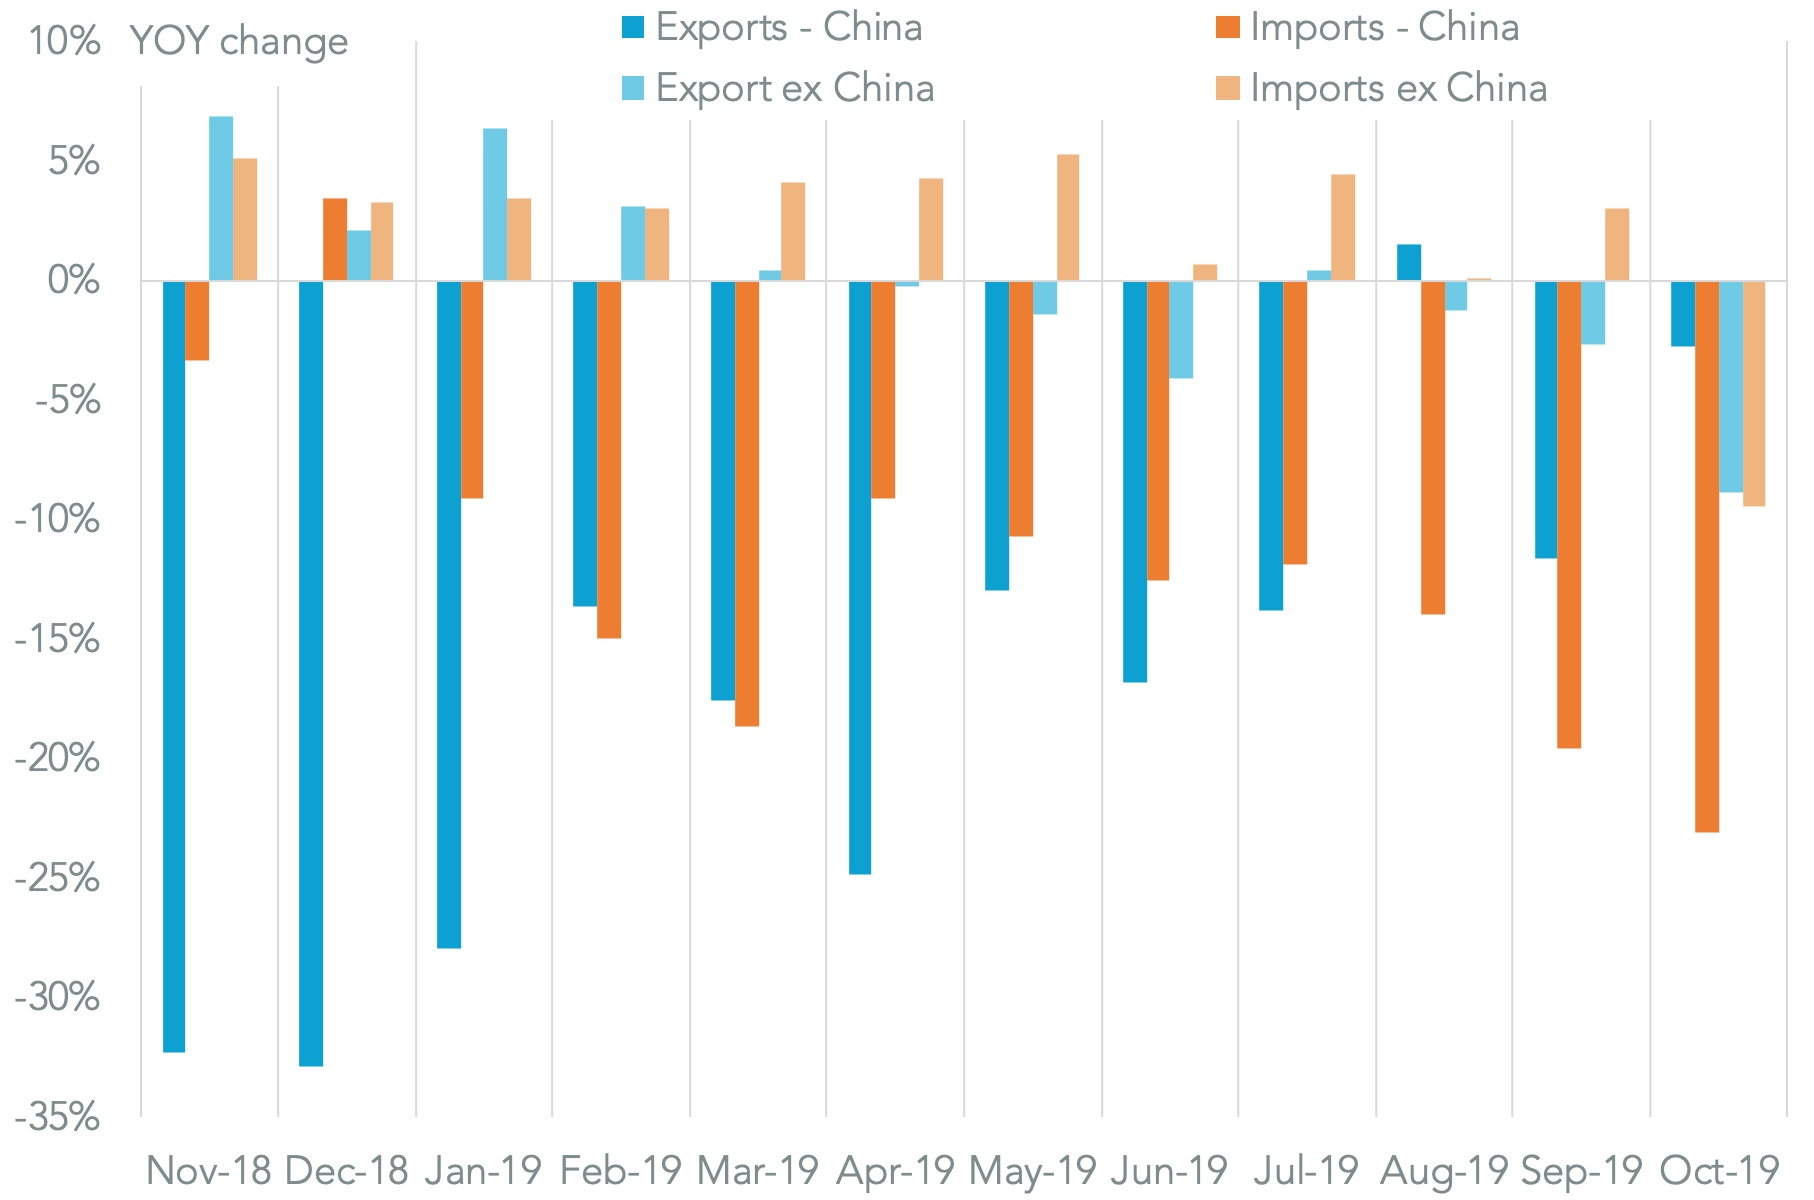
Chart segments change in U.S. goods trade activity by direction and counterparty. Calculations based on U.S. Census Bureau data. Source: Panjiva
It’s worth noting that unlike prior months, imports from the rest of the world ex-China were also down by 9.5%. That would suggest weakening of underlying demand as well as the impact of the trade war dragging on trade.
The goods deficit on a census basis fell by 13.5%, or $12.1 billion, to reach $77.0 billion. That was largely accounted for by the $11.8 billion drop in the deficit with China. By contrast the deficit with Canada and Mexico expanded by 15.7% to $12.1 billion. That was the highest for the month of October since 2007. In turn that may cast a pall over USMCA negotiations which are already beginning to run into trouble.
Trade with European Union will also be in focus with tariff squabbles over aerospace, autos and digital services taxes all ongoing. The EU remained the second largest contributor to the deficit at $16.4 billion, though it fell by 5.3% year over year, which may minimize impact of figure on the Trump administration’s positioning.
TRADE WAR WORKING, USMCA LESS SO
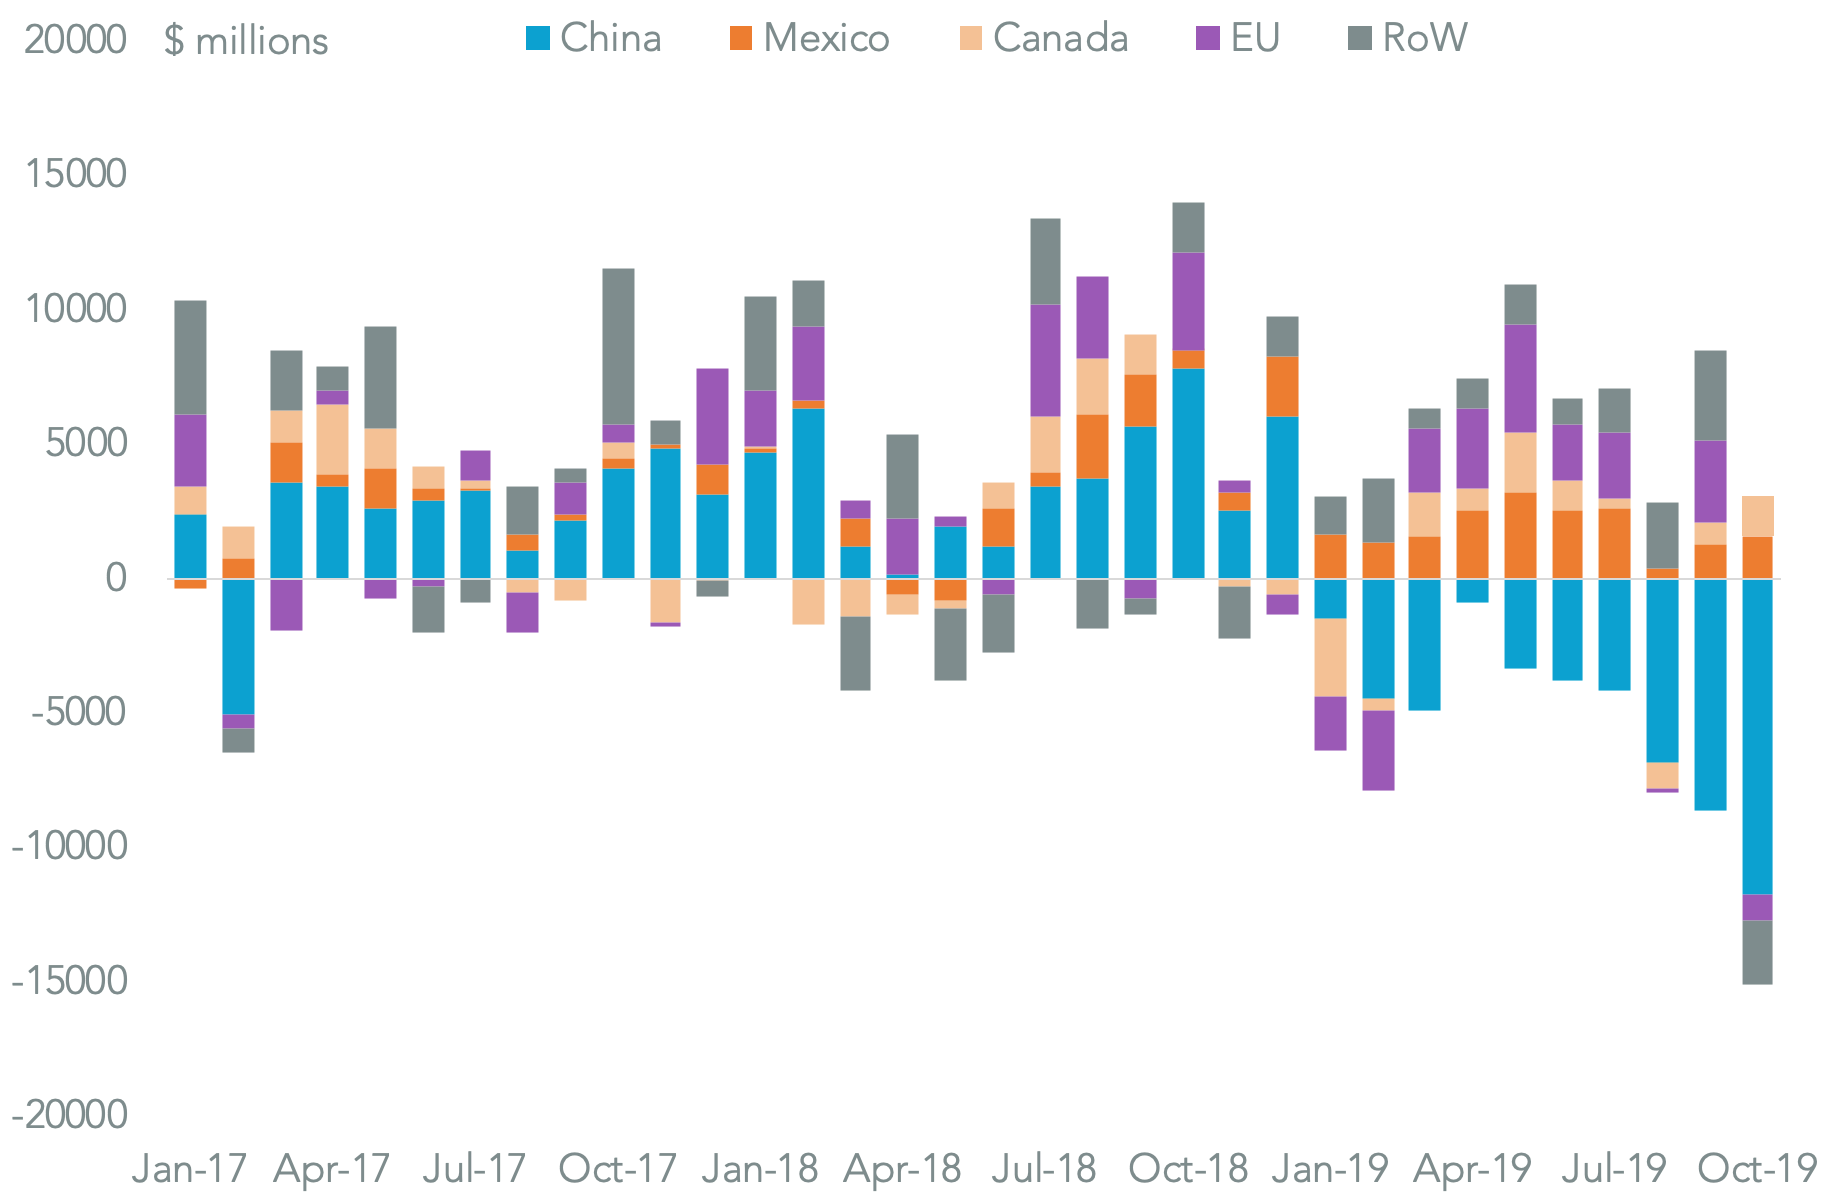
Chart segments U.S. trade-in-goods deficit by counterparty on a monthly and 12-month average basis. Calculations based on U.S. Census Bureau data. Source: Panjiva