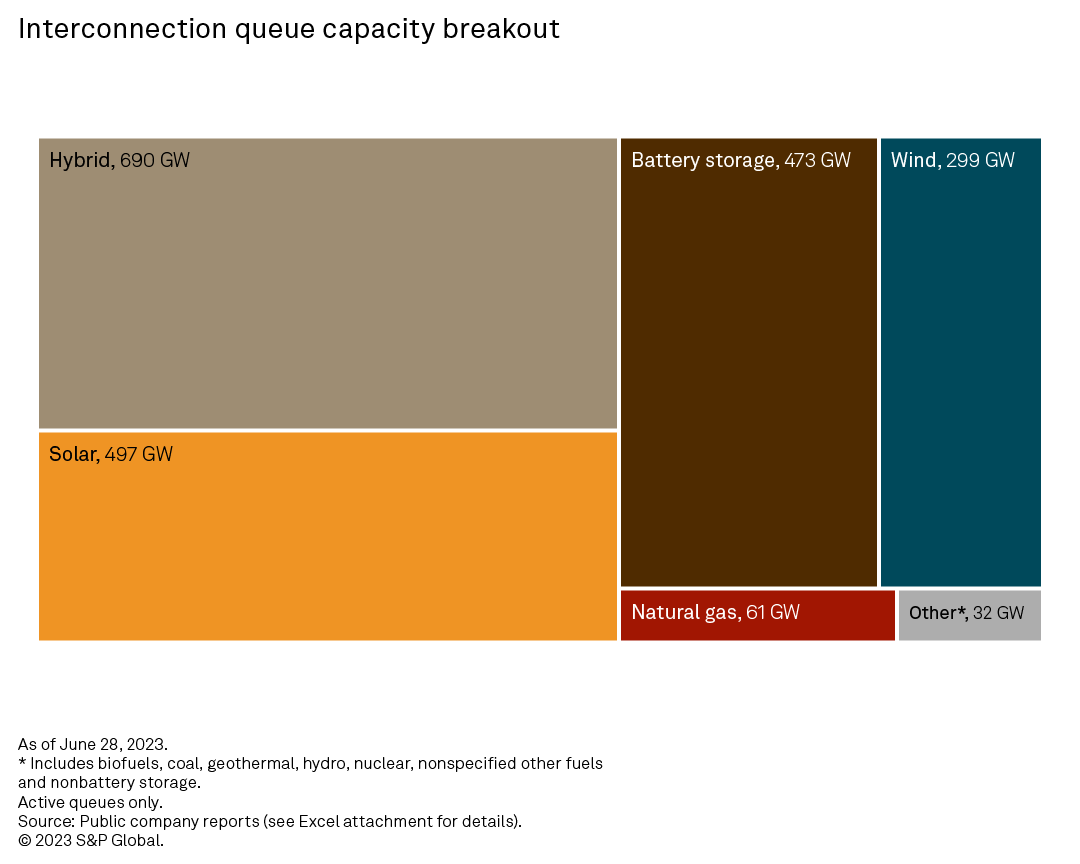
Tracked capacity from the interconnection queues of all seven US independent system operators and 14 major utilities covering geographies not managed by ISOs, including the US Southeast and the West, shows over 2,050 GW actively undergoing impact studies to connect to the grid. The queues unmistakably indicate the energy revolution in progress, with renewables accounting for a calculated 94.4% of the total and increasingly nudging out legacy fossil fuel generation.
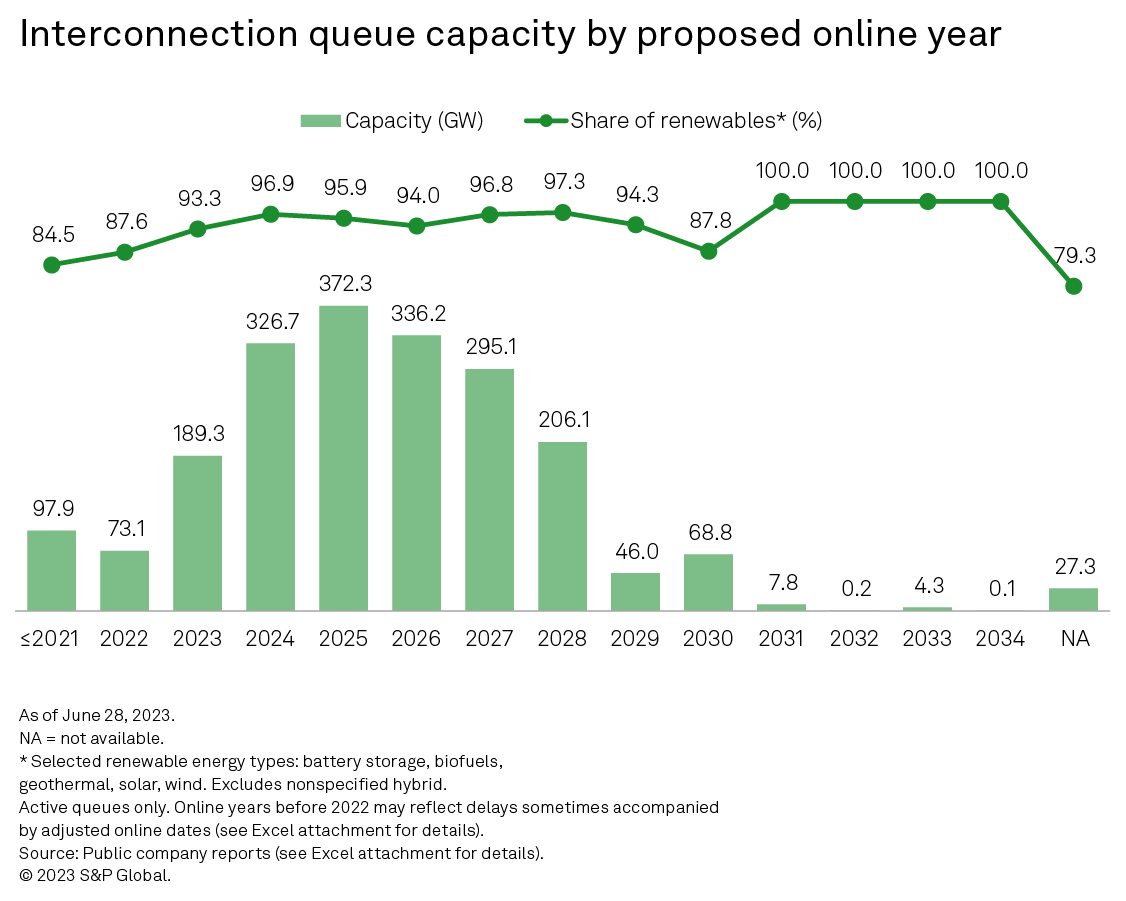
Both the volume of overall proposed capacity by year and the share of renewables in the balance illustrate the ongoing decarbonization of the power sector and the apparent impact of the Inflation Reduction Act of 2022, signed into law in August of that year. The percentage of renewables in the mix rises from 87.6% in 2022 to 93.3% in 2023, hovering around the 95% mark through most of the 2020s before accounting for the entire capacity with proposed online years in the 2030s.
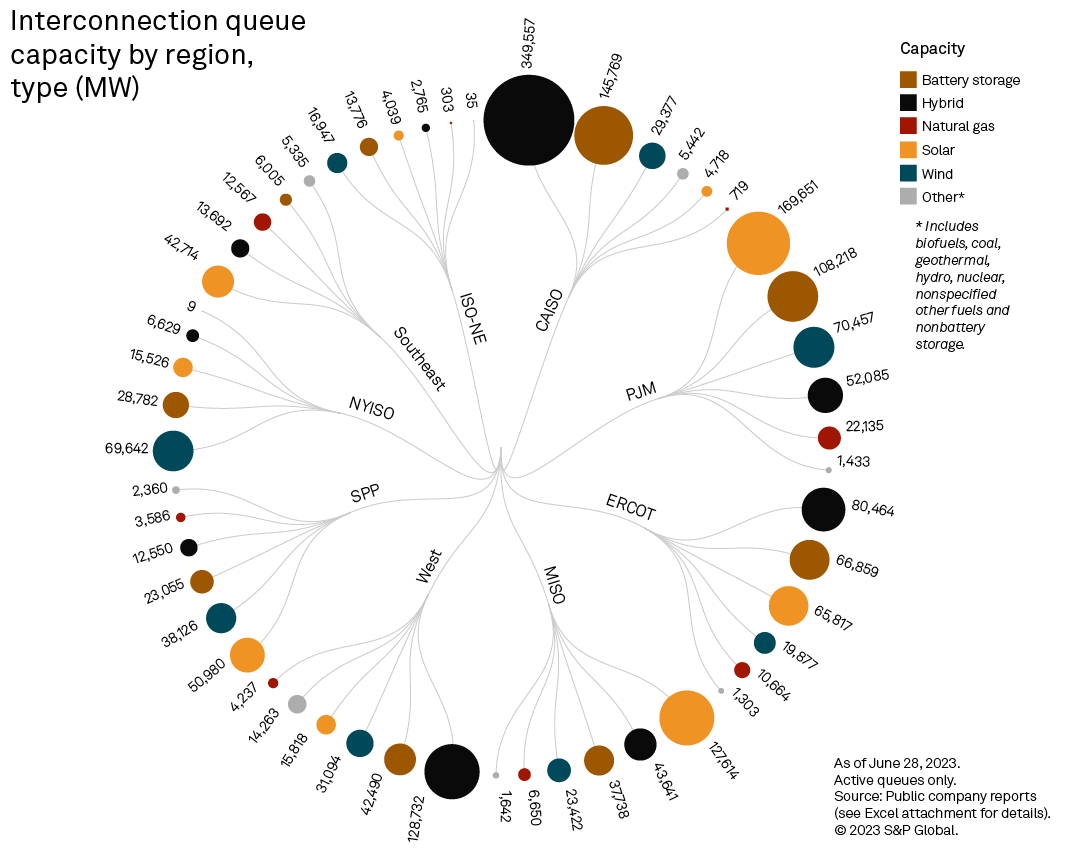
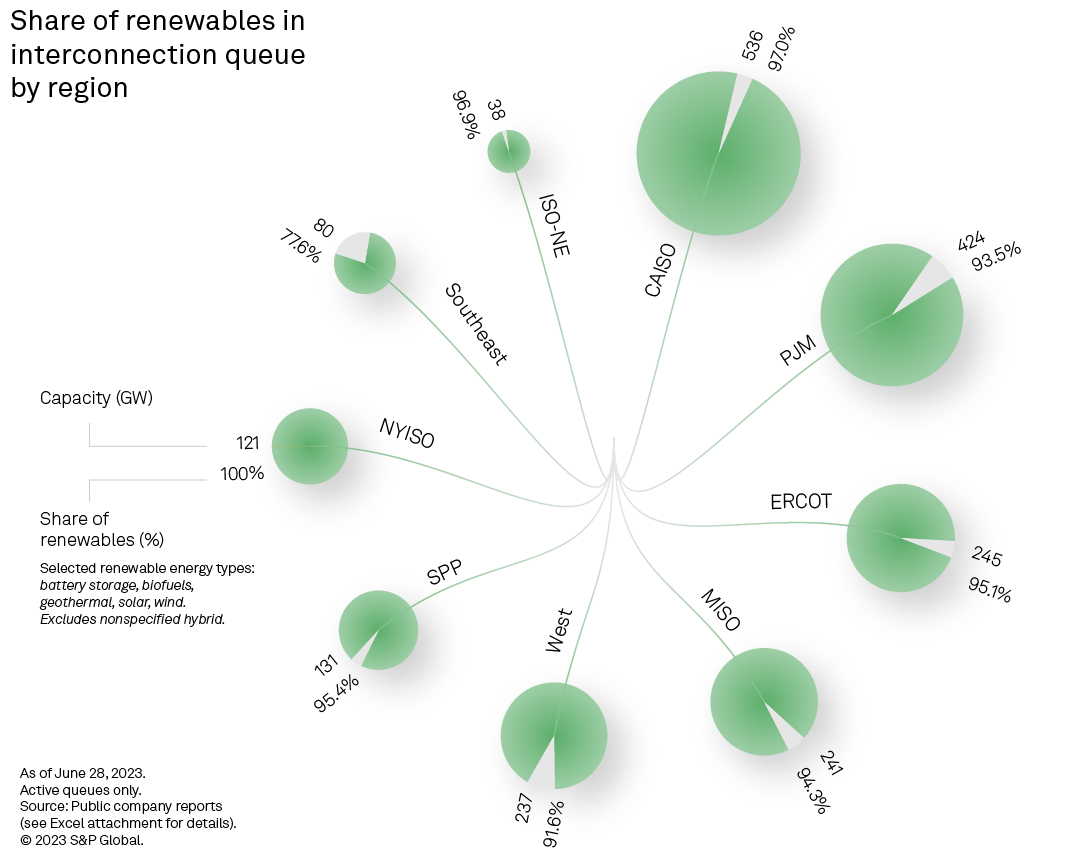
California ISO has the largest interconnection queue, with nearly 540 GW of capacity actively undergoing impact studies for grid connectivity. PJM dominates in absolute stand-alone solar capacity, however, with a proposed 170 GW — 34.1% of the tracked stand-alone solar total. The New York ISO and ISO New England lead stand-alone wind capacity, where solar resources are generally subpar and offshore wind is gaining a foothold. Hybrid configurations top the technology leaderboard in CAISO, ERCOT and the non-ISO West. The proportion of renewables in overall capacity actively undergoing impact studies for grid connectivity is firmly rooted above 90% across all regions except the US Southeast (77.6%).
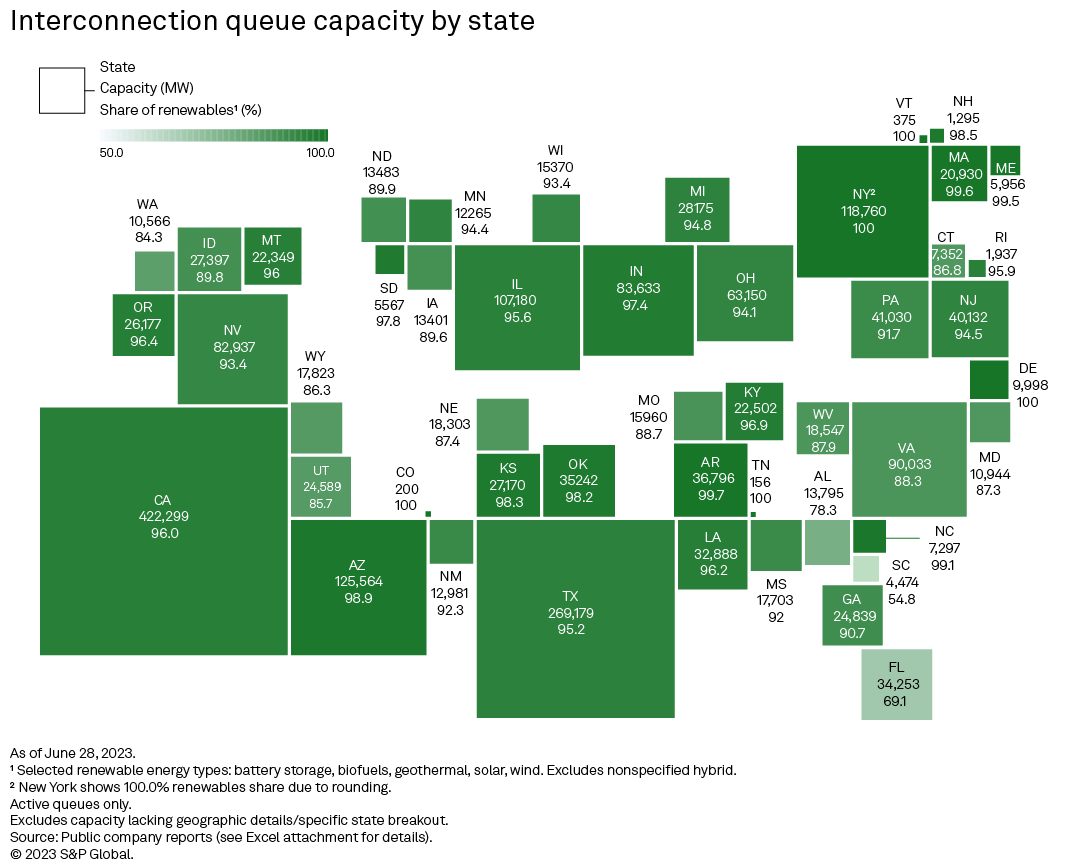
The top five states by interconnection queue capacity actively undergoing impact studies to connect to the grid — California, Texas, Arizona, New York and Illinois — contribute about 51% of the total.
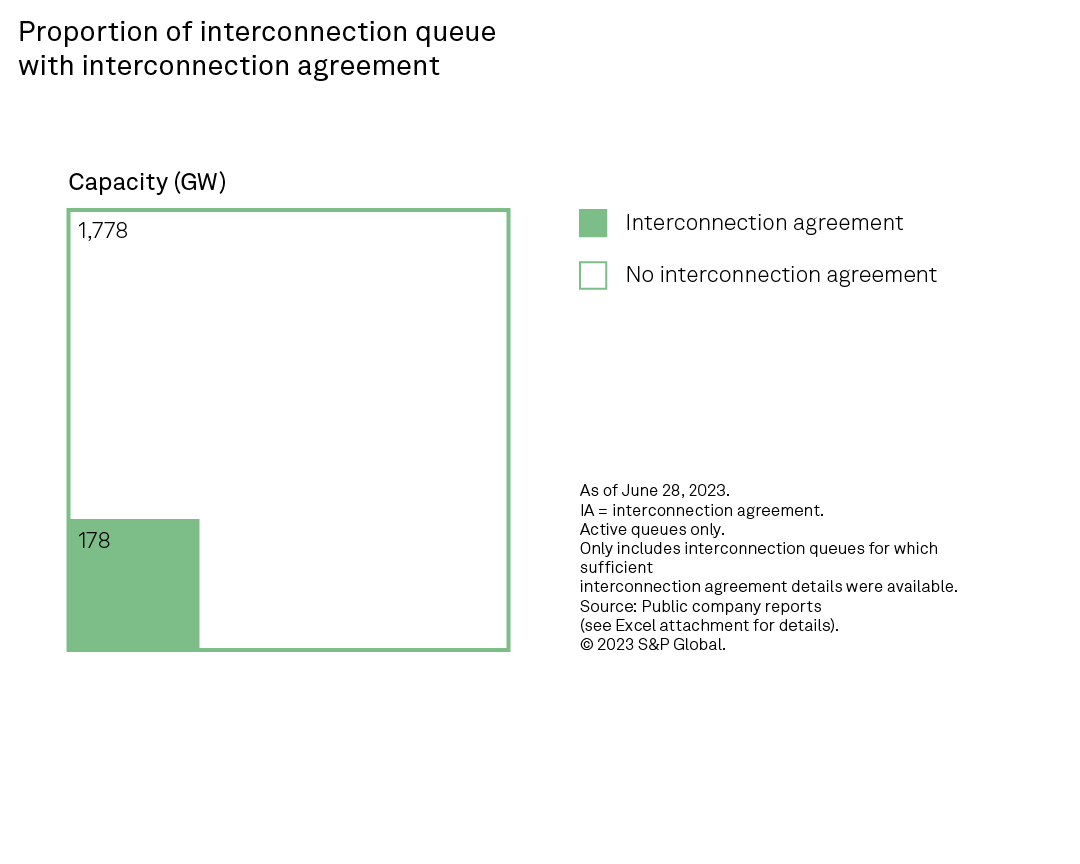
Among the queues with sufficient interconnection agreement details, just 9.1% of the listed capacity has an approved interconnection agreement, which must be obtained before a project can begin construction. Most of the tracked capacity with an interconnection agreement is intended to come online by 2024.
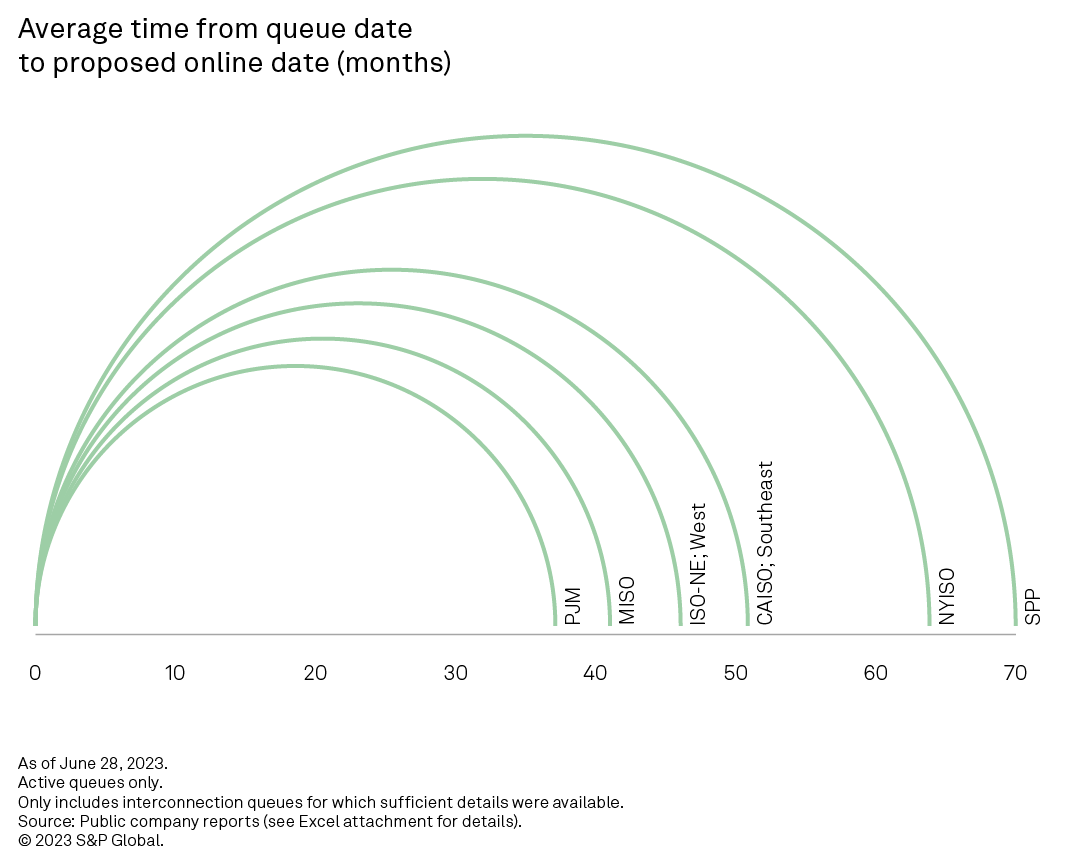
Tracked projects actively undergoing impact studies for grid connectivity underscore one of the top energy transition hurdles: long feasibility study/permitting timelines. The average duration from when a project is dropped in a queue to its proposed online date ranges from 37 months in PJM to 70 months in Southwest Power Pool (SPP).
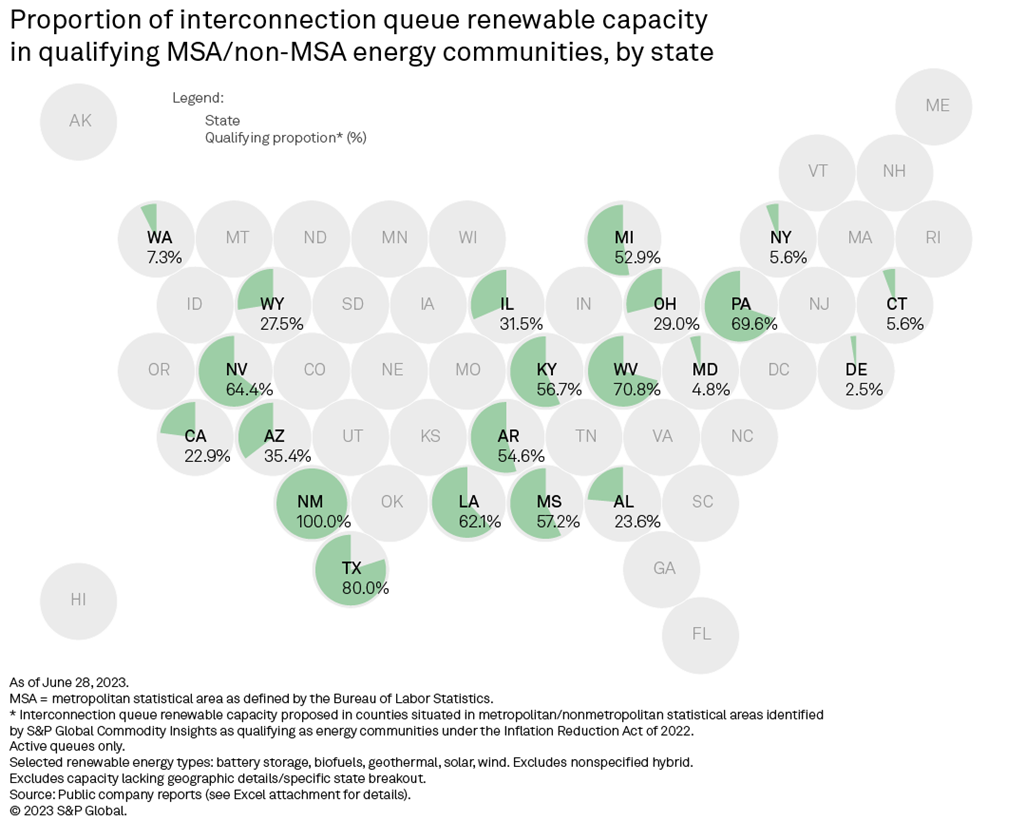
Over 580 GW of active interconnection queue renewable capacity to be sited in counties located in areas identified as energy communities under the Inflation Reduction Act. Drilling into the data, however, shows this qualification for tax credit adders under the act impacts only 21 of the states in this analysis. New Mexico tops the list with 100% of the state's active interconnection queue renewable capacity in qualifying counties; Texas is second, at 80.0%.