
The average financial quality of utility subsidiary companies for the 12 months ended in the second quarter of 2020, as measured by the metrics in this analysis, declined compared to full-year 2019 and 2018 results, but was largely in line with results for the 12 months ended in the first quarter of 2020. Return on equity dropped 46 basis points compared to full year 2019, and return on total capital slipped 14 basis points. Pretax interest coverage was off by 11 basis points, and compared to full year 2017, pretax interest coverage was down 68 basis points. That dip was largely driven by a decrease in utilities' provisions for taxes after the late 2017 tax law changes.
Dominion Energy, Inc. subsidiary Virginia Electric and Power Co., Eversource Energy subsidiary NSTAR Electric Co., FirstEnergy Corp. subsidiary West Penn Power Co., NextEra Energy Inc. subsidiary Florida Power & Light Co., Public Service Enterprise Group Inc. subsidiary Public Service Electric and Gas Co., Southern Co. subsidiaries Alabama Power Co. and Georgia Power Co., and Sempra Energy subsidiary Southern California Gas Co. were the top-performing utility operating companies for the most recent 12-month period.
The earned return on equity, which is one of the more widely followed measures of the industry's financial performance, for the 106 subsidiaries with reported data was 9.75% for the 12 months ended during the second quarter of 2020, down from 10.21% for full year 2019 and 10.34% in 2018. Extreme heat during summer 2018 bolstered sales and earnings for many utilities.
The average ROE authorized for electric companies in the first half of 2020, obtained from 27 ROE determinations, was 9.55%, below the 9.65% in full year 2019 obtained from 47 determinations. Excluding surcharge and rider cases from the data reduces first-half and 2019 average authorized electric ROE to 9.47% and 9.64%, respectively.
Average authorized gas ROE in the first six months of 2020 was 9.40%, obtained from 12 ROE determinations, compared to 9.71% for full year 2019, obtained from 32 determinations. For additional details on electric and gas rate case and ROE activity, refer to: Major Rate Case Decisions — January-June 2020.
 |
Coronavirus impacts
The coronavirus outbreak presents challenges for utilities on several fronts, including reductions in usage for certain customer classes, higher anticipated occurrence of bad-debt/uncollectibles and increased operating costs associated with enhanced biohazard safety measures. Although the broader economic effects of the coronavirus pandemic were in full force during the second quarter, most utilities' quarterly results did not reflect significant pandemic-related impacts — adjusted earnings for the companies in the energy and water utility universe were up an average of 10.2% year over year, although individual company results varied widely. Despite many companies reporting that commercial and industrial sales fell in the second quarter, most management teams affirmed existing earnings guidance ranges.
Tables 1 and 2
The tables located in a separate document provide several years of data for the 106-utility operating company group. The financial measures included in these tables are discussed below.
Pretax interest coverage — an important measure of credit quality, the average pretax interest coverage stood at 3.86x for the 12 months ended in the second quarter — below the 3.97x level in 2019 and 3.89x level in 2018, and a meaningful drop from 4.54x for 2017, with the decline largely driven by a decrease in utilities' provisions for taxes.
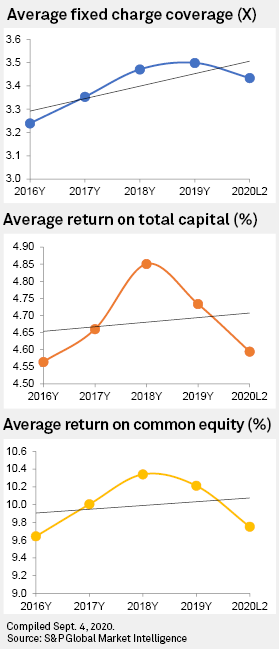
Fixed-charge coverage — This is a broader measure of after-tax income protection for bondholders and preferred stockholders. Significant capital restructurings, in combination with increased utility cost-cutting and productivity, helped strengthen this ratio over the past few years. The industry's average overall fixed charge coverage was 3.43x for the 12 months ended in the second quarter, slightly below the 3.50x for 2019 and the 3.47x for 2018, but above the 3.35x for 2017.
Return on common equity — The average annual ROE has shown a bit of weakness in recent quarters. The average earned ROE for the 12 months ended in the second quarter was 9.75%, a substantial decline from 10.21% in 2019, 10.34% in 2018 and 10.00% in 2017.
Return on total capital — This calculation is designed to measure the relative combined efficiency with which all forms of capital are used by a company to produce profits by comparing predividend earnings to total capital employed, including short-term debt. This measure was 4.59% for the 12 months ended in the second quarter, below the 4.73% for 2019, 4.85% for 2018 and 4.66% for 2017.
Capital structure data — Table 2 also displays the allocation of capital among debt, preferred stock, including minority interest, and common equity. Ratios have been fairly stable over the past several years; the common equity ratio has remained relatively steady at 50.7% as of June 30, 2020, compared to 50.4% as of Dec. 31, 2019, 51.0% as of Dec. 31, 2018 and 50.6% as of Dec. 31, 2017. The average short-term debt was 3.6% as of June 30, 2020, down from 4.9% as of Dec. 31, 2019.
This utility subsidiary report is based on information contained in the S&P Global Market Intelligence database, compiled from Forms 10-K, Forms 10-Q and company earnings releases. It should be understood that comparisons of earned ROEs and commission-authorized ROEs may sometimes be difficult or limited in value due to numerous extenuating factors, the most significant of which relates to limitations of reported data, as regulatory and financial accounting methods produce differing results. This utility subsidiary report was expanded recently to include 24 utility companies for which financial data is available.
A few subsidiaries operate in multiple jurisdictions but report on a consolidated basis, e.g., Duke Energy Corp.'s subsidiary Duke Energy Carolinas LLC operates in both North Carolina and South Carolina. In addition, some utility subsidiaries act as intermediate holding companies with reported financials that include other smaller subsidiaries, e.g., Spire Inc. subsidiary Spire Missouri Inc. owns Missouri Gas Energy. We also note that some companies carry traditional multistate utility operations as "divisions" but combine those operations for reporting purposes, e.g., Atmos Energy. Those companies are not included in this report.
Data for subsidiaries of New Jersey Resources Corp. and Spire are for the period ended Mar. 31, 2019. These companies' fiscal years end Sept. 30.
Regarding the earnings used in this report, we have removed the effects of non-recurring items, such as discontinued operations, write-offs, mark-to-market valuation changes, prior-period tax settlements or other one-time accounting adjustments, to the extent that information is available from SEC documents.
Regulatory Research Associates is a group within S&P Global Market Intelligence.
For a complete, searchable listing of RRA's in-depth research and analysis, please go to the S&P Global Market Intelligence Energy Research Library (subscription required).
This article was published by S&P Global Market Intelligence and not by S&P Global Ratings, which is a separately managed division of S&P Global.