
Introduction
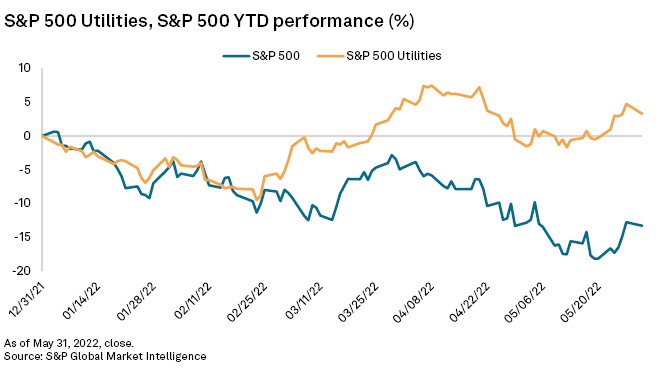
Though equity investors remained largely pessimistic in May while they assessed the rising prospects of an economic recession amid soaring inflation, energy utility stocks remained in favor as the S&P 500 Utilities group rose 3.8% to push year-to-date gains to over 3%. The S&P 500 underperformed in May, finishing flat, and the tech-heavy Nasdaq Composite declined 2.1%, with the indexes down 13.3% and 22.8%, respectively, in 2022.
In addition to its traditional status as a defensive play during times of economic turbulence, first-quarter EPS results may also have contributed to recent positive investor sentiment in the sector, with most energy utilities surpassing S&P Capital IQ consensus EPS estimates. A number of recent gas utility acquisitions may also be supporting utility valuations, with attractive assets continuing to fetch a premium in recent transactions, particularly those paid by private utility operators.

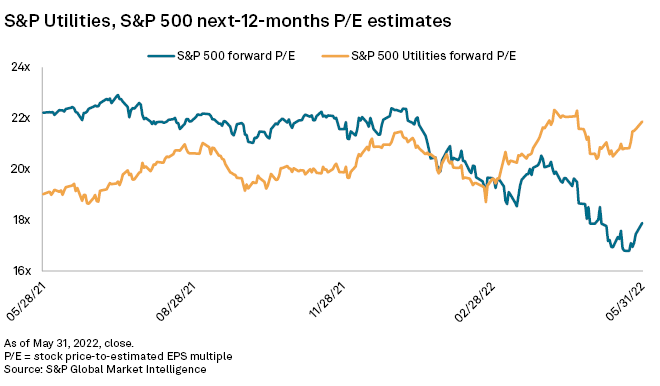
The S&P 500 Utilities index extended its valuation premium to approximately 21% over the S&P 500 in May on multi- and electric utility stock outperformance during the month, up from 14% at the end of April.
The S&P 500 Utilities index was one of just two subsectors trading in positive territory in May. Bolstered by skyrocketing oil prices, the S&P 500 Energy index was up nearly 56% at the end of the month. The consumer discretionary indexes have fared worst — down about 25% — amid soaring inflation, strained global supply chains and plummeting consumer sentiment.
Several overarching economic, political and public policy issues present challenges

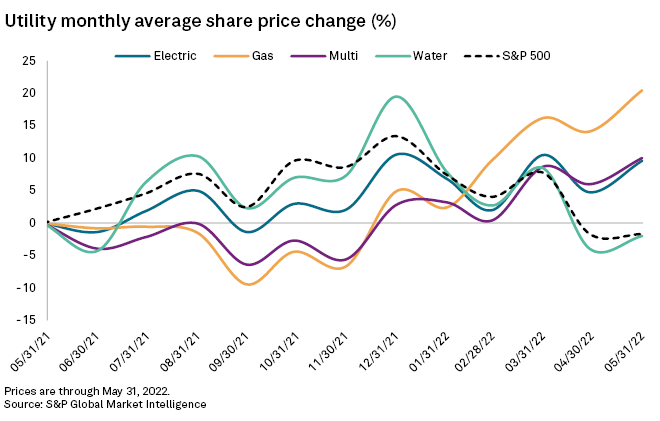
Continuing April's trend, gas utility stocks — led by Northwest Natural Holding Co. — again outperformed electric, multi-utility and water equities. The Northwest Natural shares rose 13.5% in May to lift year-to-date price appreciation above 11%. By comparison, gas utilities rose 5.8% on average in May and were up 15.5% on average in 2022.
Early in the month, Northwest Natural reported first-quarter EPS that missed consensus estimates by approximately 5% but reaffirmed 2022 earnings guidance range, as well as a long-term EPS growth target of 4% to 6% that looks to be increasingly supported by its growing water operations. On May 26, Northwest Natural announced it signed agreements to acquire a small portfolio of customer connections in Washington that would expand its water utility footprint in the region if the transaction is completed later in 2022.
With May's share price increase, Northwest Natural's forward share price-to-estimated EPS, or P/E, multiple increased more than 14% to 20.1x, versus the gas utility group average of 19.5x. Acquisition target South Jersey Industries Inc.'s forward P/E held relatively steady at 19.3x in May, a marginal increase from 19.0x at the end of April. Recent transactions for gas utility assets have bolstered valuations and stock prices for such assets: TriSummit Utilities Inc.'s recent $800 million offer for Alaska gas distributor Enstar represented 2.3x the assets' 2021 rate base and 29x allowed earnings.
Multi-utility forward P/E multiples expanded approximately 4% in May to an average 19.4x 2023 estimated EPS, led by Alliant Energy Corp.'s 9% increase to 22.0x and NiSource Inc.'s 8% increase to 20.3x, with both increases closely matching that of the companies' stock price in May. NiSource's share price appreciation may reflect investors' expectations that the company's ongoing strategic review may yield one or more sales announcements in the coming months, as the company looks to fund its renewables-heavy capital expenditure program.
Water utility valuations remained elevated relative to energy utilities through the end of May, trading at about 27x the 2023 estimated EPS. Much of the sector underperformed during the month with stocks up 5.6% on average. Year-to-date, water utility stocks are down more than 17% on average, weighed by Middlesex Water Co. and California Water Service Group's
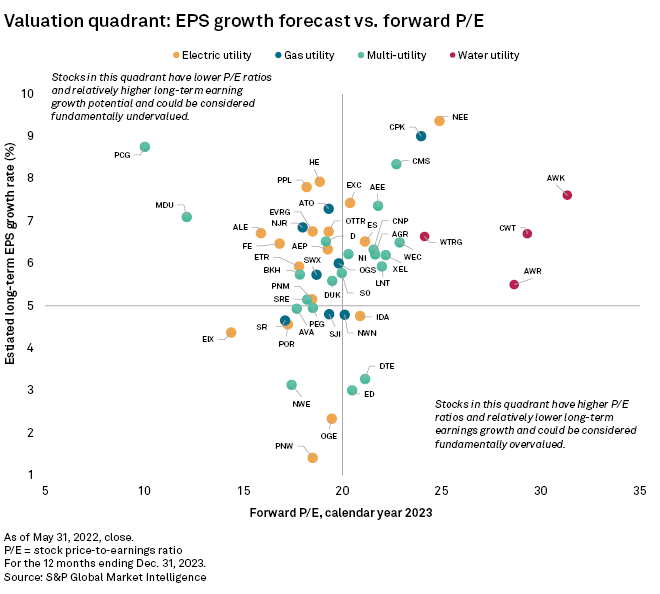
The quadrant chart below shows how Regulatory Research Associates' utility universe appears when comparing the P/E ratio and the estimated long-term earnings growth rate. A sizeable portion of electric utility P/E multiples has remained in the upper-left quadrant in 2022, suggesting the companies could be relatively undervalued, considering their lower P/E values and long-term earnings growth potential.
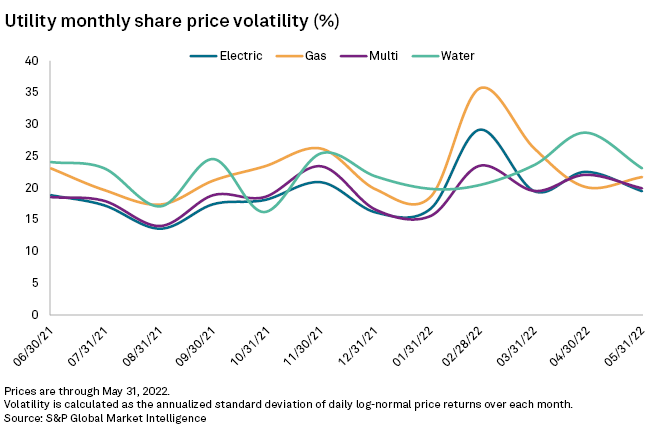
Share price volatility
Smaller-cap companies generally have lower trading liquidity, and, therefore, all other things being equal, tend to have more significant share-price swings than larger-cap equities. An analysis of the standard deviation of log-normalized daily price returns for utility stocks over the past year supports this thesis, with the smaller-cap water utility sector displaying the highest average price volatility.
Following consecutive declines in March and April, average gas utility share price volatility increased to 21.7% in May from 21.1% in April, with increases in Northwest Natural and Chesapeake Utilities Corp. trading volatility offsetting decreases observed in the Southwest Gas Holdings Inc. and Atmos Energy Corp. shares.
In the electric utility sector, average trading volatility declined to 19.5% in May from 22.5%; the decline was more pronounced amongst water utilities, with average trading volatility declining to 23.1% from 28.7%.
Regulatory Research Associates is a group within S&P Global Commodity Insights.
This article was published by S&P Global Market Intelligence and not by S&P Global Ratings, which is a separately managed division of S&P Global.