
Though much less dependent on geography than the fossil fuel sector, renewables are far from location-neutral, as illustrated by our world tour of average offshore wind speeds.

The world's great bodies of water vary in their capacities to support offshore wind energy. Wind capacity in the northern countries of Western Europe benefits from some of the world's top average offshore wind speeds in the North Sea and the Baltic, with speeds in some areas hovering near 10 meters per second.
The U.S. Atlantic seaboard, notably its northernmost section, is not far behind. Unlike Western Europe countries, however, the U.S. has yet to take full advantage of these abundant natural resources.

The image below is a video presentation; please click on the image to access controls to play, pause or navigate to specific video frames. To view the video in full screen, please click the square at the bottom right of the video player; to exit full-screen view, please click "x" or press the "Esc" key.

With green objectives and disentanglement from the geopolitics of fossil fuels in mind, the world is racing to build renewable energy capacity, harnessing solar and wind power on land and water to meet energy transition milestones. Powered by generally higher average wind speeds and resulting higher capacity factors than their onshore counterparts, offshore wind projects, which circumvent the land availability constraint, have a key role to play in this transition.
Worldwide, Western Europe tops the offshore wind charts, accounting for more than 75% of global operating offshore wind in 2021 and roughly two-thirds of global planned offshore wind capacity as of October 2022. Furthermore, the region's northern part boasts the highest 22-year weighted average wind speed among the world locations designated in this report. Note that this analysis revolves around broad geographies, not specific economic areas such as the EU or other legal entities.
Operating and planned offshore wind projects across Germany, Belgium, the Netherlands, U.K. and the Nordics, essentially in the North Sea and the Baltic, show average wind speeds for the most part ranging from 9 meters per second to 10 m/s from 2000 through 2021. In comparison, the weighted average wind speed for the southern portion of Western Europe, with offshore wind projects mostly concentrated in the relatively placid Mediterranean Sea, comes in at about 6.5 m/s. Average wind speeds are sensitive to the exact coastline and often increase with distance from land. The resolution of the wind speed data set is about 27 kilometers. Variations in exact distances from coastlines can affect the projects' actual wind speed capacity.
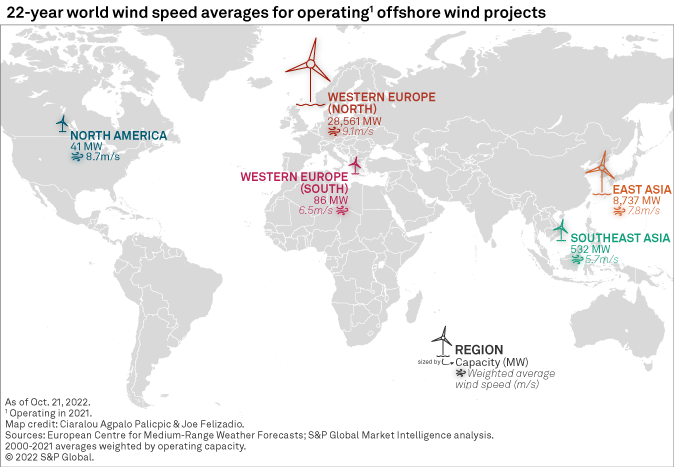
In the designated Western Europe area, U.K. offshore wind stands out. Not only does it lead the region, and the world, in operating and planned offshore wind capacity, but it also boasts 22-year weighted average offshore wind speeds ranging from 9 m/s for projects that operated in 2021 to 9.7 m/s for projects in the pipeline as of October 2022. In 2021, the U.K. was home to the world's second- and third-largest offshore wind farms — 1.3-GW Hornsea II Offshore Wind Project and 1.2-GW Hornsea I Offshore Wind Project (Njord).
Located in the North Sea approximately 75 miles off England's east coast, the Hornsea projects' areas show average wind speeds above 9.5 m/s from 2000 through 2021. Capitalizing on these offshore wind speeds — among the fastest in the world — Ørsted A/S subsidiary Orsted Power (UK) Ltd. is in the process of developing the Hornsea III Offshore Wind Project. Once completed, the project, which has a planned capacity of 2.4 GW, could meet the average daily energy needs of more than 2 million U.K. homes, according to Orsted.
North America ranks last on our list with global operating offshore wind capacity of only 41 MW, entirely based in the U.S., in 2021. The region shoots up to second place when looking at planned projects due to a U.S. pipeline of nearly 33 GW, but it remains significantly behind Western Europe and its 134 GW of planned offshore wind. With the bulk of its larger population centers along its windy coasts, the U.S. arguably is a more natural fit than most Western European markets for the development of offshore wind. But headwinds such as costs, aesthetic considerations and opposition from competing interests have hampered the sector's development in the North American region to date.
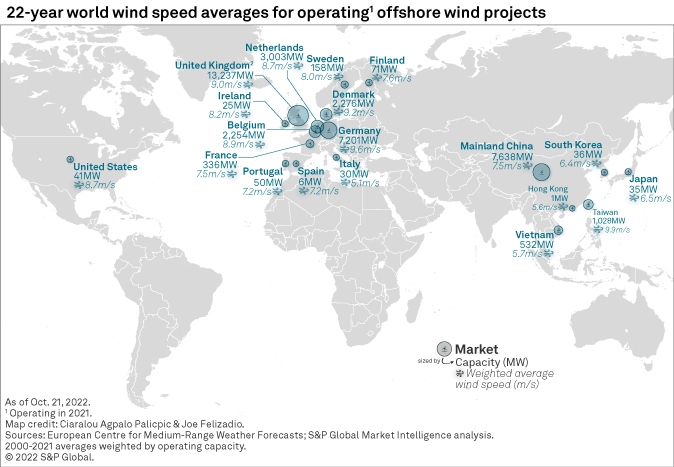
Commodity Insights estimates that wind speeds where U.S. offshore projects operated in 2021 — including the 29.3 MW Block Island Offshore Wind and the 12 MW Coastal Virginia Offshore Wind (Virginia Offshore Wind Technology Advancement Project) — averaged a weighted 8.7 m/s from 2000 through 2021. For planned U.S. offshore wind projects, the metric comes in at a weighted average of 8.4 m/s.
Analyzed offshore wind speeds for U.S. projects in the pipeline vary nonnegligibly. Those may be organized across three broad geographies — the East Coast, the Pacific and the Gulf of Mexico. The highest U.S. offshore wind speeds are found along the country's Atlantic seaboard, notably off the coasts of the northeastern states of Connecticut, Massachusetts and Rhode Island. Speeds drop to an 8 m/s to 8.3 m/s range across the rest of the East Coast and to less than 8 m/s around planned projects in the Pacific. In the Gulf of Mexico, analyzed speed averages range from 5.9 m/s for projects off the coast of Louisiana and 6.7 m/s for Texas-based farms.
For wholesale prices and supply and demand projections, see the S&P Global Market Intelligence Power Forecast.
Regulatory Research Associates is a group within S&P Global Commodity Insights.
S&P Global Commodity Insights produces content for distribution on S&P Capital IQ Pro.
This article was published by S&P Global Market Intelligence and not by S&P Global Ratings, which is a separately managed division of S&P Global.