
Download The Full Report
Click hereExecutives have become increasingly positive in their statements in the most recent earnings conference call season. The improving sentiment can be confirmed by observing changes in supply chain activity. The relationship between improved management sentiment and increased activity can be seen in the Industrials and Consumer Discretionary sectors.
Exhibit 1: Improving Sentiment Backed by Accelerating Shipment Growth for Industrials, Consumer Discretionary and Materials, Reverse True in Energy
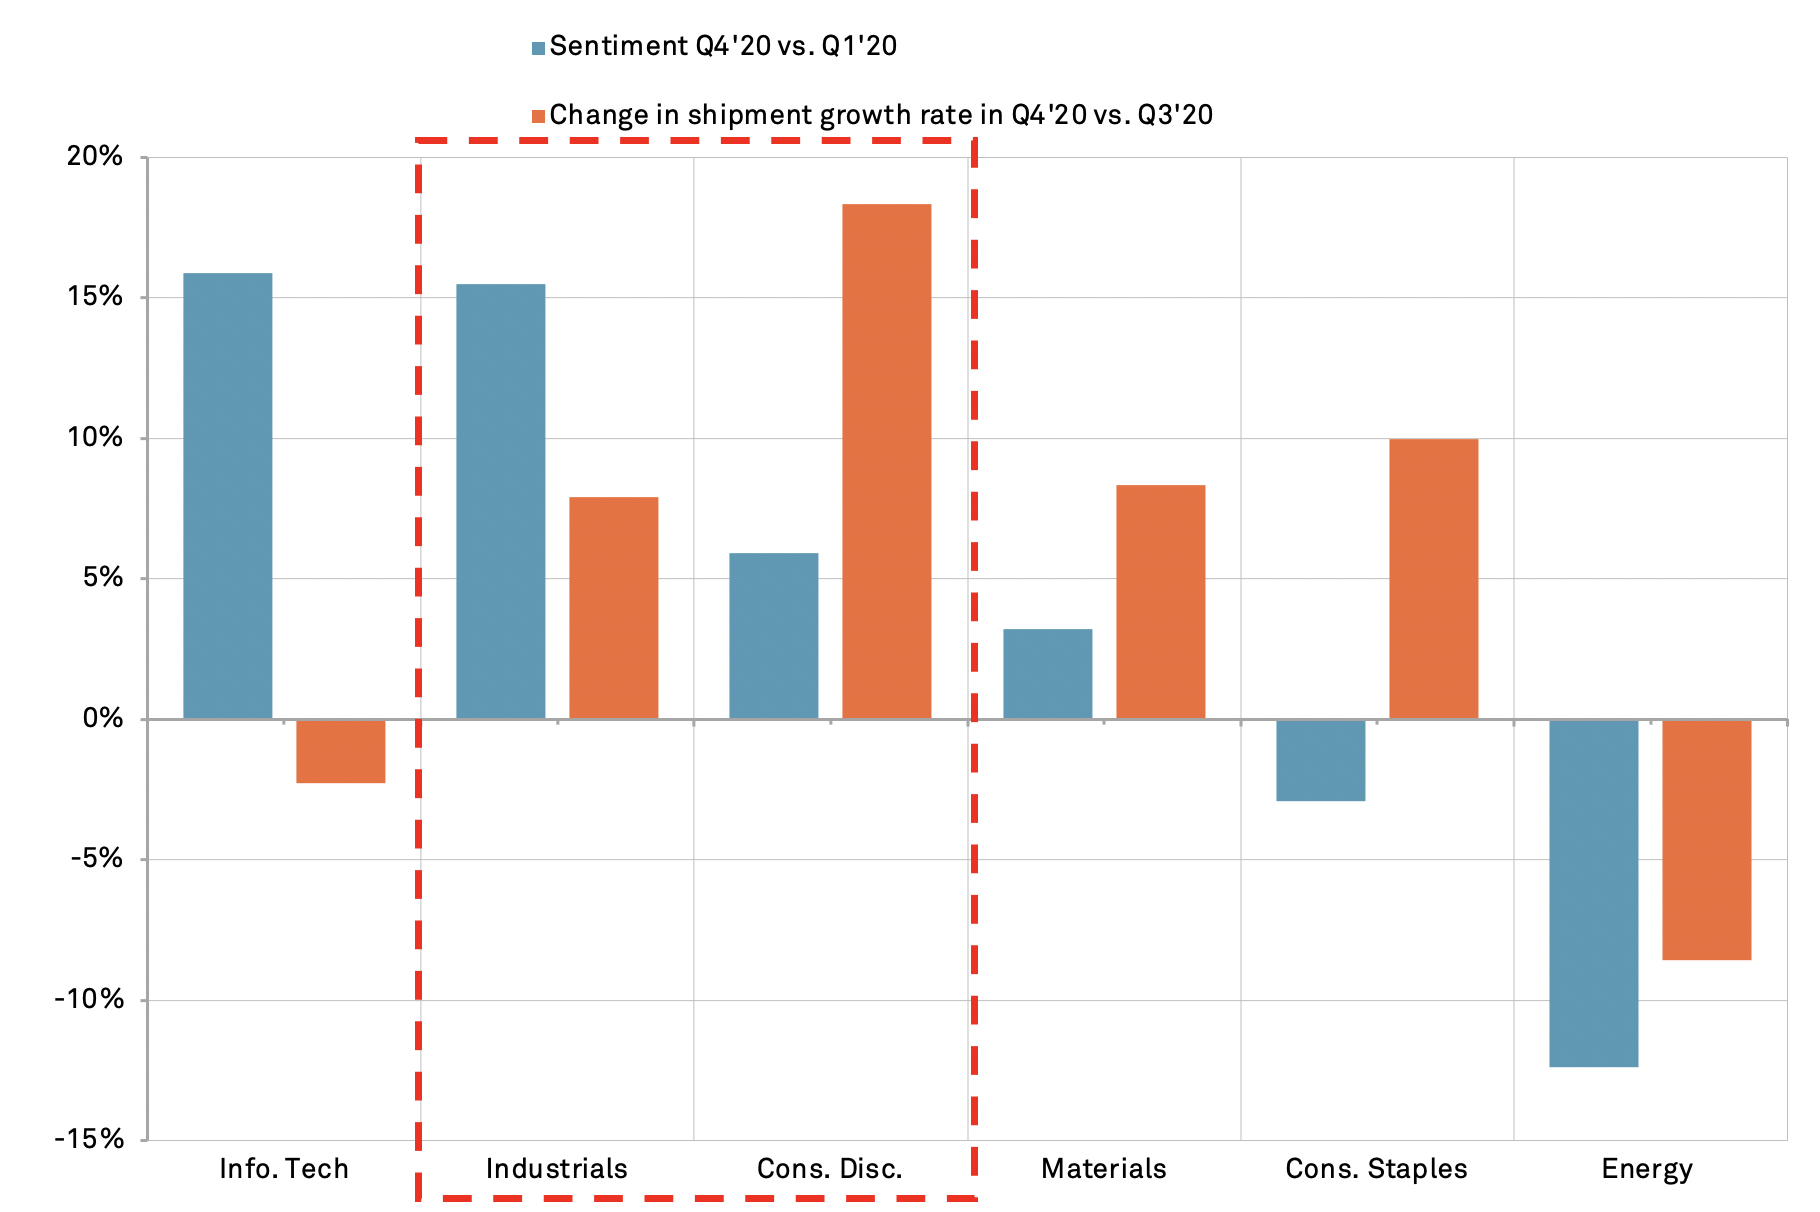
Chart compares change in net positivity score on earnings conference calls to change in rate of shipment growth in U.S. seaborne imports. Source: S&P Global Market Intelligence Quantamental Research. Data as of 11/15/2020
Sentiment still improving but below pre-pandemic levels
Earnings conference calls relating to Q3’20 earnngs that were held in Q4'20 have shown a marked increase in management optimism, with net positivity rising by 36.6% when compared with calls held in the previous quarter. That likely reflects improved activity after the pandemic's industrial lockdowns but was still 9.3% below the pre-pandemic calls of Q1'20. Only the Industrials and Consumer Discretionary sectors have improved quarter-on-quarter and versus pre-pandemic levels (exhibit 2 below).
Exhibit 2: Sentiment Back to Pre-Pandemic Levels in Just 4 Out of the 11 GICS Sectors
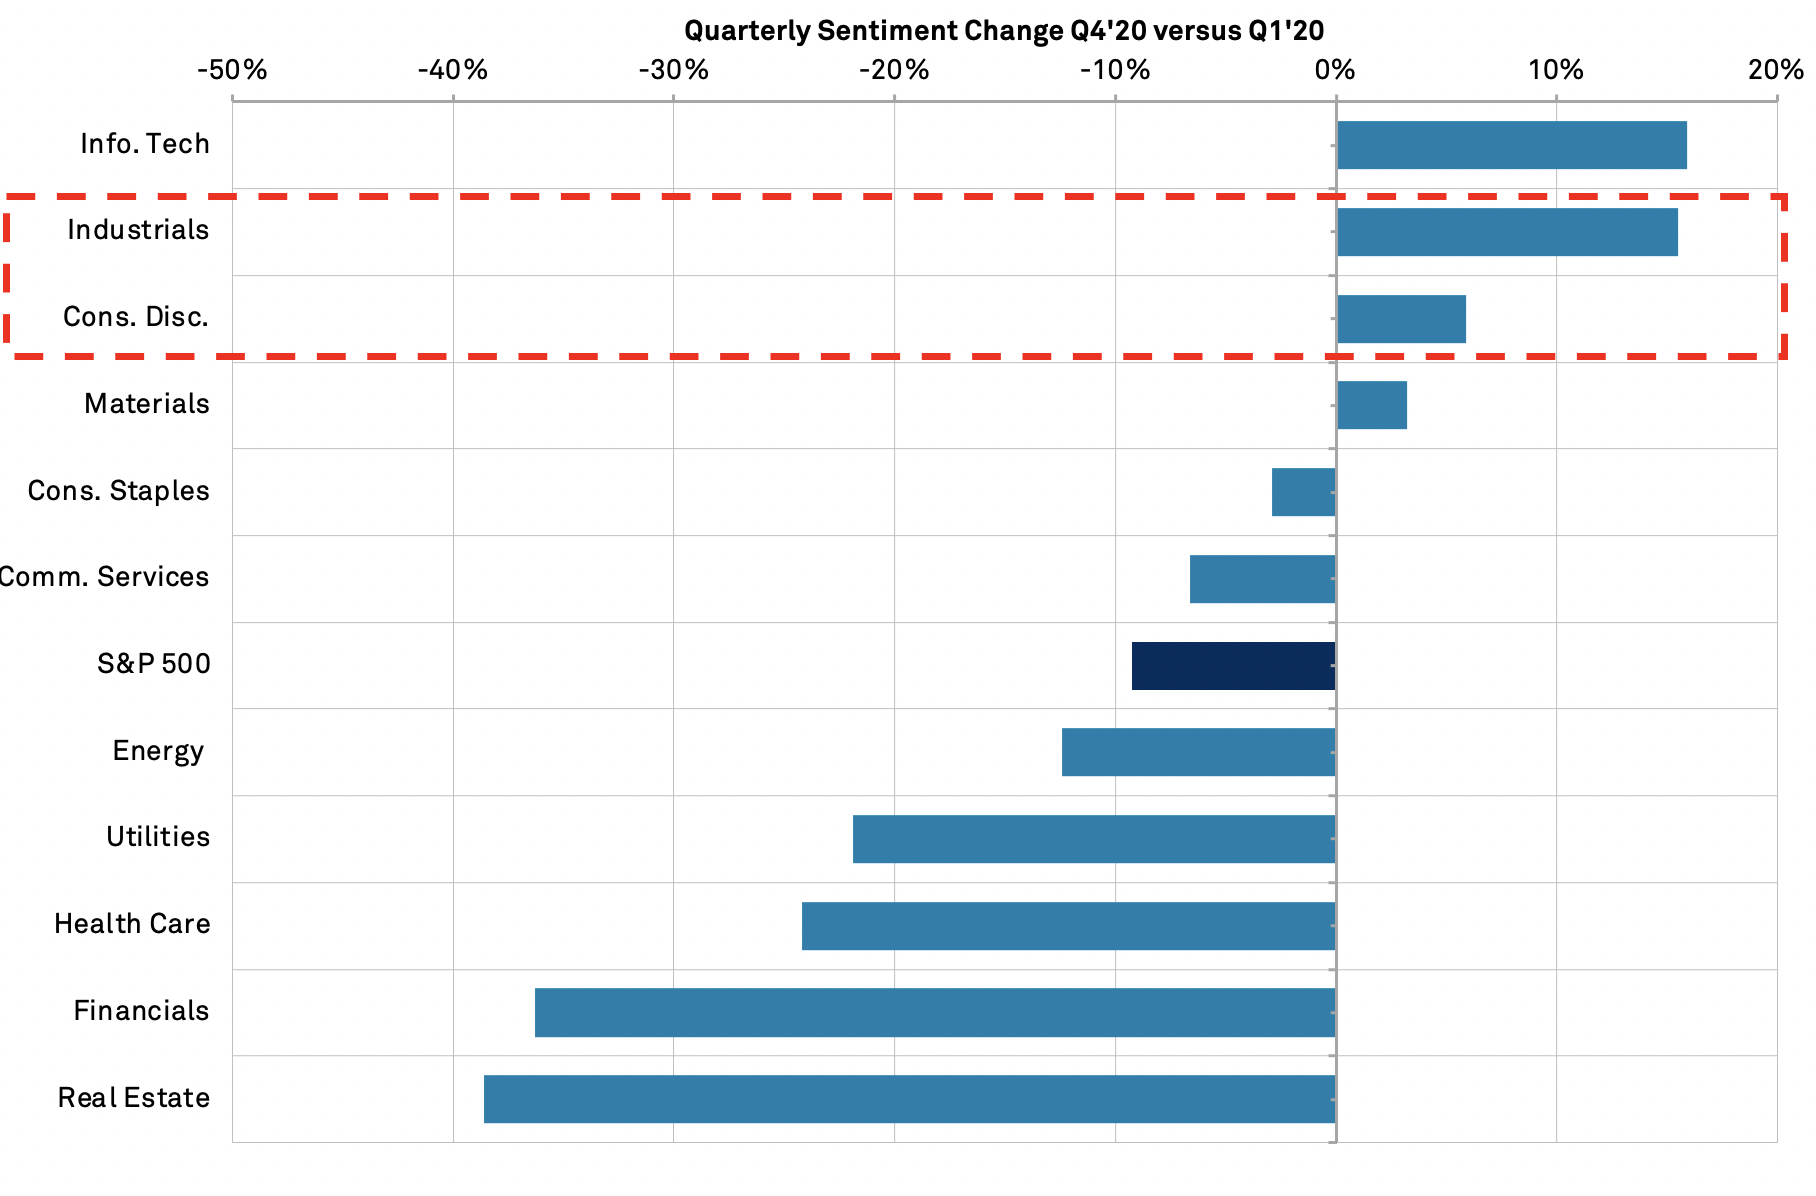
Chart segments change in sentiment in earnings conference calls, measured by net positivity score under S&P Global Market Intelligence's TDA system, by GICS. Time period refers to when the call was held. Source: S&P Global Market Intelligence Quantamental Research. Data as of 11/15/2020