Introduction
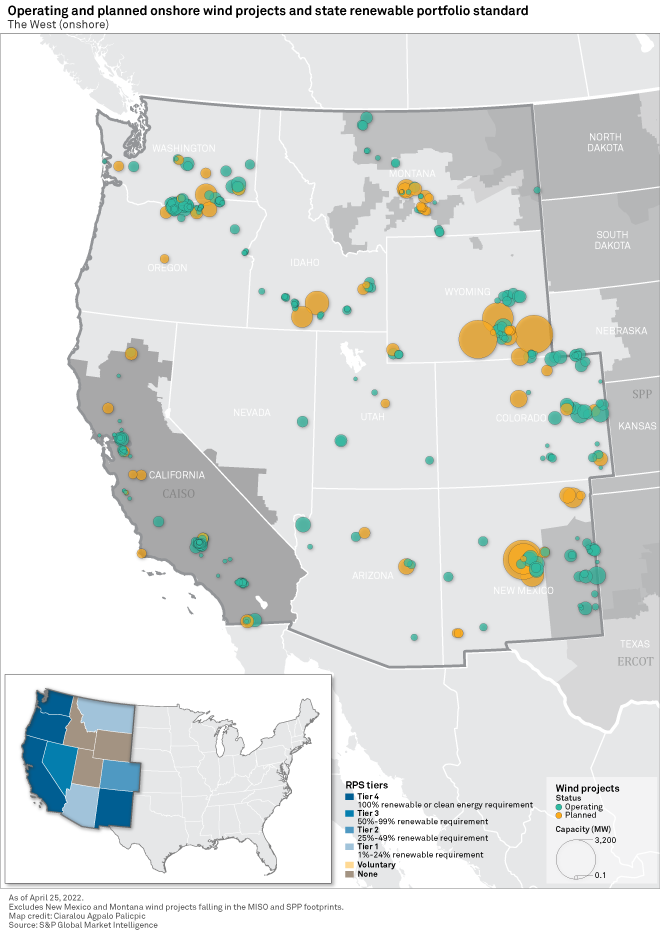
Led by Wyoming and New Mexico, which rank second and third, respectively, in planned onshore wind capacity in the U.S., the West has the most wind capacity in development among the five U.S. regions designated in this analysis. The West region, which includes all states in the Western Interconnect, boasts a combination of aggressive state renewable targets, high wind resources areas and low-cost, undeveloped land. These regional drivers, combined with the federal production tax credits, have developers flocking to the West, leading to a pipeline topping 27 GW of onshore wind capacity across the region.

The economic outlook for wind in California is not particularly positive, but aggressive renewable legislation combined with resource adequacy requirements should keep wind in demand for the foreseeable future.
New Mexico has one of the brightest outlooks for wind, thanks to strong demand via increasing renewable portfolio standard mandates as well as very favorable economics.
Even with the lack of state-level support for wind, Wyoming wind projects are forecast to make full equity returns, owing to low costs and strong wind resources boosting energy revenue.

Regional overview
The West is the largest region, covered in this report, both in terms of square mileage and population. Thus, it is not surprising it ranks at the top in terms of development interest for wind. Eleven states are covered in this region: Arizona, California, Colorado, Idaho, Montana, Nevada, New Mexico, Oregon, Utah, Washington and Wyoming. It is the most legislatively diverse region in the U.S. in terms of renewable support. Three states — Idaho, Utah and Wyoming — have no mandatory renewable portfolio standard in place. On the other end of the spectrum, four states — California, New Mexico, Oregon and Washington — have an end target of 100% carbon-free generation by 2045 or earlier. The remaining four states have renewable portfolio standards with varying requirements.
As is the case in other regions, wind interest in the West is not necessarily tied to aggressive state renewable requirements. Wyoming has nearly 10 GW of wind in the pipeline — ranking second in the U.S. behind Texas — and has no renewable portfolio standard in place. New Mexico has just over 8 GW of wind in development and has a 100% carbon-free target. Thanks to the federal production tax credit, developers have been able to build financially lucrative wind farms without the backing of robust state-level support.
Geographically speaking, the West has some of the least densely populated states in the contiguous U.S., which means plenty of open land space for large commercial-scale wind development. Additionally, wind resources are generally favorable across the region, with the far eastern portion having some of the best average wind speeds in the country. With the assistance of the production tax credits as well as other high-level drivers, including increasing corporate renewable interest, interest in wind has grown exponentially. The eastern states of Montana, Wyoming, Colorado and Wyoming make up over three-quarters of the onshore wind capacity in planning in the West.
The California ISO is the only operating ISO in the region. However, the Energy Imbalance Market, or EIM, is run by CAISO and is a real-time energy market that covers territory in 10 of the 11 states. Colorado is the only state with no coverage in the EIM, as state utilities Xcel Energy Inc. subsidiary Public Service Co. of Colorado and Black Hills Corp. subsidiary Black Hills Colorado Electric chose to join the Southwest Power Pool's Western Energy Imbalance Service market over the EIM. By 2023, most major Western utilities will be EIM participants, making it one of the largest real-time energy markets in the country. The expansion of the EIM will aid the integration of renewable energy in the West and bolster overall grid reliability. With wind and solar expected to continue growing in the region, the EIM expansion will help to limit curtailment of these resources as well.

California
SB 100 was signed in 2018, putting California on a path to being 100% powered by zero-carbon resources by 2045. Interim requirements are set at 44% of retail electricity sales from eligible renewable resources by 2024. This target increases to 52% in 2027 and again to 60% by 2030. Wind development in California, however, predates any sort of renewable legislation with commercial-scale projects installed as early as 1975 and several more built throughout the 1980s. California was the pioneering market for wind in the U.S. but has since slipped behind Texas and other Midwestern states.
California ranks sixth in the U.S. with over 6.5 GW of operating wind capacity. Over the last 10 years, solar has overtaken wind in renewable development interest in the Golden State, with nearly 16 GW of operating utility-scale solar. The preference for solar continues looking at the pipeline for renewables in California, with solar outpacing wind by nearly a 5-to-1 ratio. California remains one of the largest overall markets for clean energy in the U.S. due
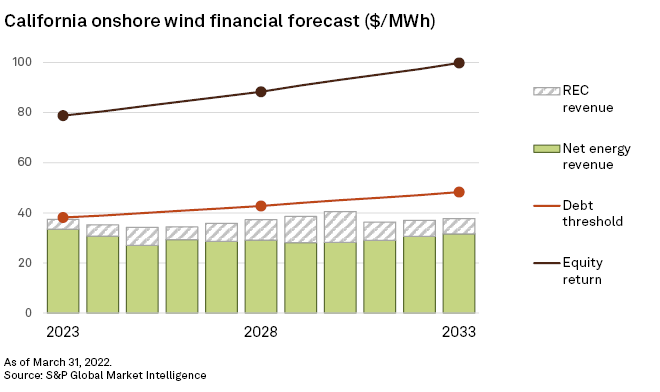
Economic projections for wind in California are among the least favorable over the next decade. Energy and renewable energy credit revenue combined is not expected to meet the minimum debt service threshold at all over the next decade. Combined revenues are close to reaching the debt threshold in California in 2023, but the gap steadily increases throughout the period. Renewable energy credit revenue ranges between $3.85/credit and $12.25/credit. The minimum debt service requirement starts at $38.12/MWh in 2023 and rises steadily to $48.27/MWh in 2033. The full equity return line over the next period is $78.79/MWh in 2023 and increases to $99.77/MWh in 2033. Forecast thresholds from the solar investment outlook were around half these figures, pointing to more favorable economics for solar in the state.

Wind contract rates to the three main investor-owned utilities in the state — Pacific Gas and Electric Co., San Diego Gas & Electric Co. and Southern California Edison Co. — for recently signed deals typically range between $45/MWh and $55/MWh, though some contract rates are still at the $80/MWh range. Though the economics for solar look more favorable than wind in California, resource adequacy requirements, particularly in the looming retirement of the Diablo Canyon nuclear plant, will help keep wind an attractive resource, as energy providers fight to maintain grid reliability as well as meet state renewable energy targets.
New Mexico
New Mexico passed into law the Energy Transition Act in 2019, which set annual renewable energy targets of 50% in 2030 and 80% by 2040. State energy providers must eventually transition to 100% carbon-free energy by 2045. In addition to this ambitious renewable portfolio standard, numerous other drivers in New Mexico are leading to rapidly increasing pipelines for wind and solar.
The state also has one of the best combinations of solar and wind resources in the country. Analysis of capacity factors for operating wind projects through 2020 places New Mexico sixth in the country at 40.4%. Solar is similarly favorable, with average performance ranking fourth at 28%. Additionally, the state's largest utility, PNM Resources Inc., joined the EIM in 2021 allowing renewable projects in the territory access to the real-time energy market that covers much of the West. Far east portions of the state, where the better wind resources are typically found, are in the Eastern Interconnect, giving these projects potential access to renewable energy credit markets in the East. Finally, New Mexico is one of the least densely populated states among the lower 48, providing plenty of land for commercial-scale renewable development.
There are over 4.2 GW of operating wind capacity in New Mexico, ranking 10th in the country. The aforementioned drivers, however, have pushed the pipeline for wind to just over 8 GW of proposed capacity — fifth in the country and third in terms of just onshore wind capacity behind only Texas and Wyoming. Wind development outpaces that of solar by a 2.5- to-1 ratio in New Mexico, though there is still a notable pipeline of 2.7 GW of solar in planning.
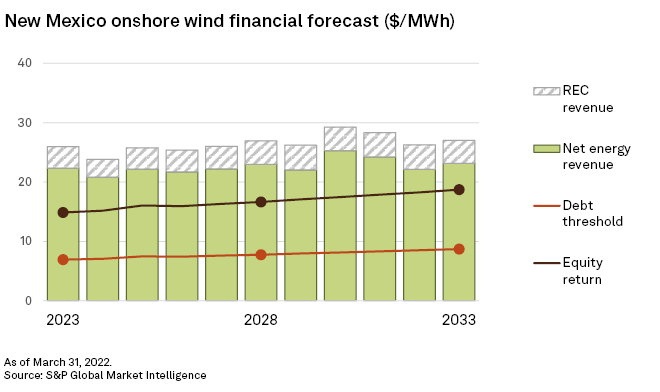
The economics for wind in New Mexico are among the most favorable in the country. Due

The Federal Energy Regulatory Commission's Electric Quarterly Reports show wind transactions to PNM Resources, ranging between $17.48/MWh and $31.44/MWh in New Mexico. The 102.4-MW Red Mesa Wind Farm, operated by NextEra Energy Inc., initiated its contract with PNM in January 2015 at the $31/MWh rate. The 306-MW La Joya Wind Plant, completed in 2021 and operated by Avangrid Renewables LLC, has two different contracts with PNM, with the most recent selling for $17.48/MWh — right at the median rate for a full equity return on a wind project in New Mexico.
Wyoming
Wyoming has no renewable portfolio standard in place and essentially no incentives of any kind to speak for commercial-scale wind or solar, owing, in part, to the coal and natural gas industries heavily intertwined in the state's economy. This lack of state-level support is not hindering the interest in wind, as developers are flocking to Wyoming to take advantage of some of the best wind resources in the entire country. Wind projects in Wyoming averaged a capacity factor of 35.2% through 2020, ranking 11th. This is likely partially driven down by older projects operating in the state. Nearly half of the operating capacity in Wyoming was installed in 2010 or earlier. There was a notable slowdown in wind development in the state from 2011 to 2019. Of the 66 GW of wind capacity that was installed across the U.S. during this period, only one project totaling 80 MW was installed in Wyoming.
Wyoming has just over 3 GW of operating wind capacity, ranking 17th in the country. Declining costs of wind and the continued federal production tax credits made the Wyoming market too attractive to bypass eventually. After the noted lull in wind development, over 1.5 GW of wind capacity has been installed since 2020 in the state. The pipeline of wind continues this aggressive ramp-up in development interest, with over 9.7 GW of wind in planning, ranking second in the country. It is noteworthy though that 80% of this proposed capacity comes from just three projects — Chokecherry and Sierra Madre Wind Energy Project owned by The Anschutz Corp. subsidiary Power Company of Wyoming (3 GW), Pathfinder Wyoming Wind Project (3 GW) owned by Pathfinder Renewable Wind Energy LLC and Little Medicine Bow Wind Farm (Viridis Eolia Master Plan) (1.9 GW) owned by Viridis Eolia LLC.
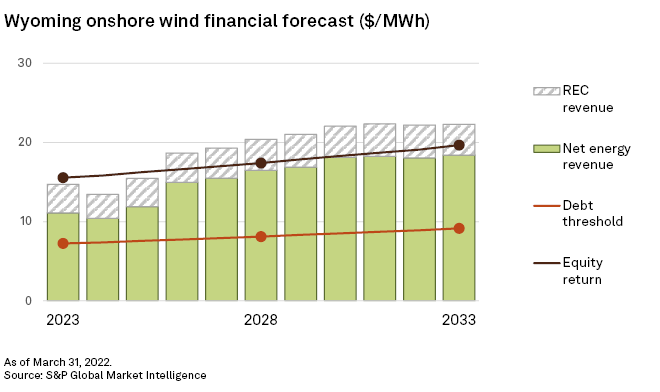
New wind projects are forecast to be profitable over the next 10 years in Wyoming. Projects are privy to both energy revenue and voluntary renewable energy credit revenue, but low forecast costs make new projects economical. The minimum debt service threshold, which increases from $7.25/MWh in 2023 to $9.16/MWh in 2033, is surpassed throughout the period. Forecast energy revenue for Wyoming wind farms is $11.10/MWh in 2023 and increases to $18.42/MWh in 2033. By 2026, combined energy revenue and voluntary REC surpasses the full equity return barrier, which maxes out at $19.67/MWh in 2033.

FERC's Electric Quarterly Reports transaction rates for Wyoming wind projects have a wide range with older projects, including the Rock River I, Mountain Wind I Project and Mountain Wind II Project projects, all commissioned before 2010, showcasing rates between $35.48/MWh and $61.8/MWh. More recently, the Cedar Springs I Wind Project and Cedar Springs III Wind Project, both completed in 2020, have rates between $15/MWh and $17/MWh — right in line with the projected full equity return threshold over the next decade.
Regulatory Research Associates is a group within S&P Global Commodity Insights.
Tony Lenoir, Kristin Larson, Monesa Carpon, Ciaralou Palicpic and Chris Allen Villanueva contributed to this article.
This article was published by S&P Global Market Intelligence and not by S&P Global Ratings, which is a separately managed division of S&P Global.


