
The financial industry is rattled by events of the past week. It should come as no surprise since the demise of Silicon Valley Bank (SVB) ranks as the 2nd-biggest bank failure in U.S history.
It instantly brought back memories of global financial crisis, especially what unfolded in the aftermath of the collapse of Lehman Brothers. Scarred by those events, the distress was visible throughout the financial markets with regulators, depositors, banks, tech companies and many more scrambling to make sense of what happened and to contain the damage.
So far, regulators have moved swiftly to facilitate protection of affected customers, with the FDIC transferring deposits and assets to a newly created “bridge bank” in the US, and HSBC acquiring Silicon Valley Bank UK Ltd. for a symbolic £1 price tag in UK. This has brought some sense of stability and calm to the markets. While still to be seen whether this is the calm before the storm or whether the contagion risk is fully contained, one must appreciate the quick actions taken so far.
Many factors were at play in SVB’s failure and amongst that its inability to return deposits being withdrawn by customers due to insufficient liquid assets was a key one. Therefore, asset and liability management is a highly pertinent topic. In this blog, banks in Europe and Middle East & Africa are reviewed from an asset and liability management perspective to see how many assets banks have to cover their liabilities maturing at various timeframes. In addition, readers will find information on other relevant data points such as the liquidity coverage ratio, net stable funding ratio and break down of liquidity metrics that are currently available to our users to conduct further analysis on this topic.
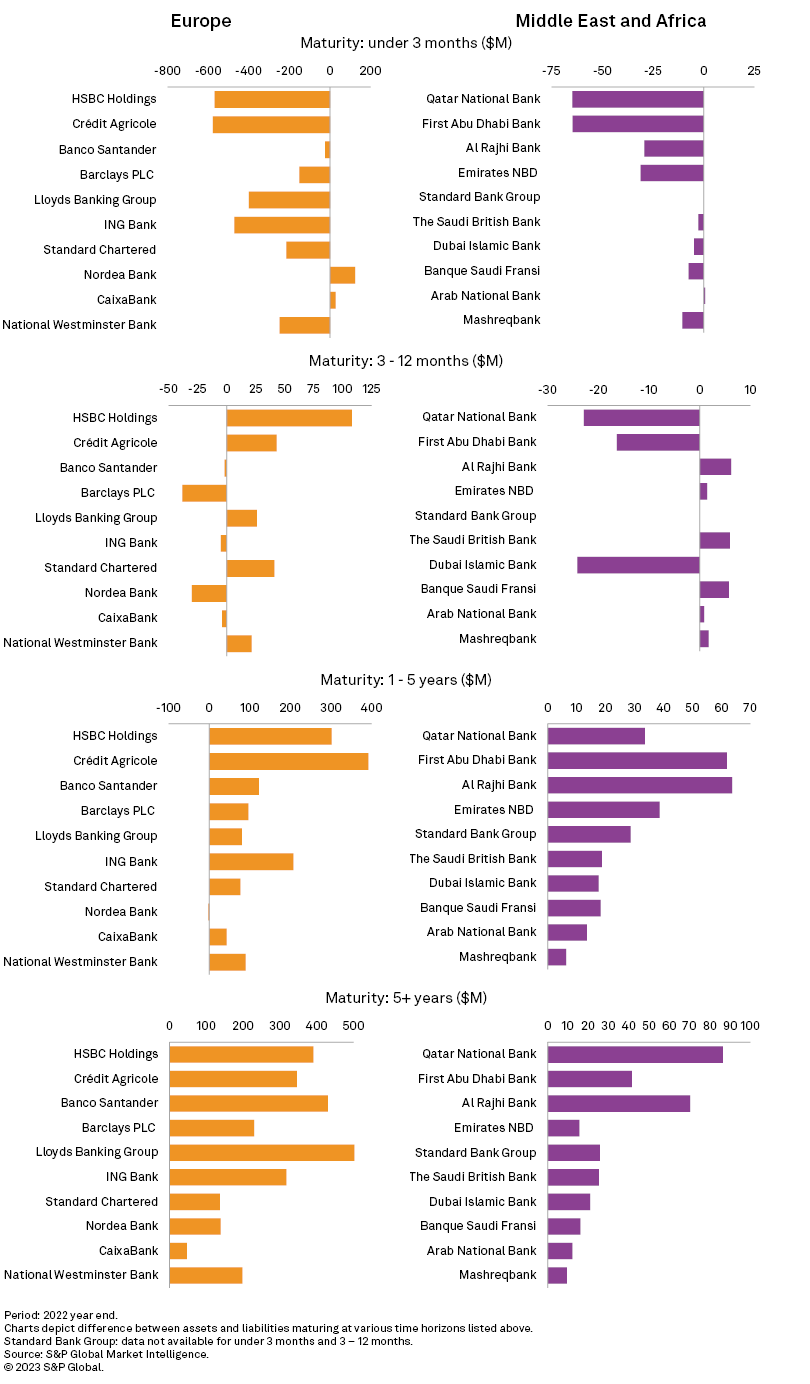
In the graphs below, I’ve taken the difference between assets and liabilities maturing at different durations for top ten banks by 2022 year-end assets in Europe and Middle East & Africa, where there was sufficient data reported for assets and liability for various maturity periods. Where sufficient data was not available across the four time horizons, I have excluded such banks and therefore the list of banks is not necessarily the top ten by assets in absolute terms. Furthermore, financial assets payable on demand and liabilities available on demand were not widely reported and not included as part of the analysis. We can see that banks in Europe as well as Middle East & Africa have more liabilities maturing in under 3 months compared to assets maturing in the same time period, while it’s a mixed bag in the 3-12 month time period. On the other hand, if we look at longer term maturities, we can clearly see that the banks have sufficient assets maturing to counter the liabilities due.
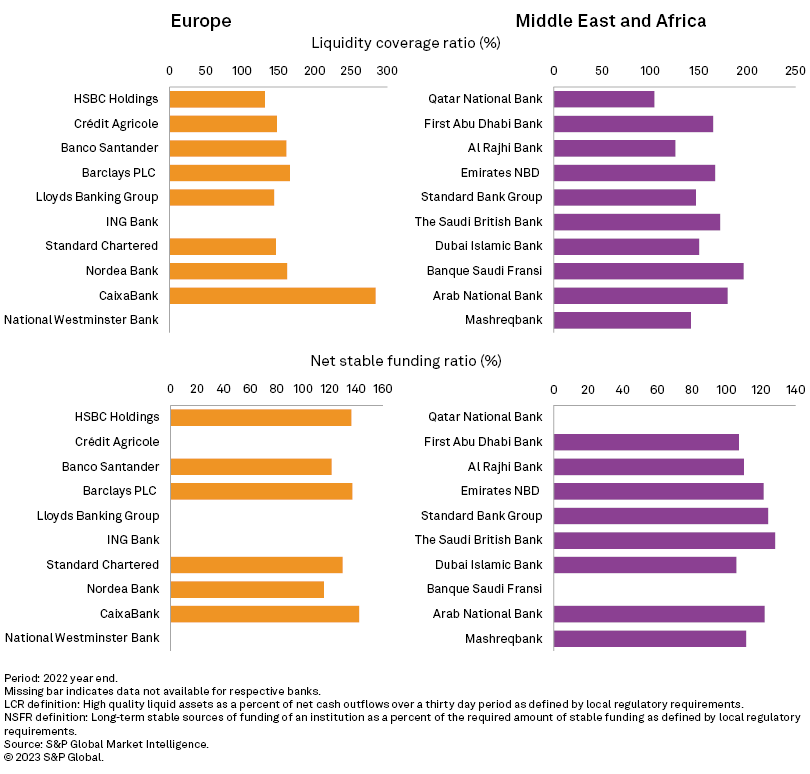
Two other metrics that are important are liquidity coverage ratio and net stable funding ratio, minimum standards for which were introduced by Basel Committee on Banking Supervision as a response to global financial crisis. The former promotes short-term resilience of a bank’s liquidity risk profile, especially in a high stress scenario lasting for 30 days. While the latter is focused on funding over a longer timeline to ensure there are stable sources of funding. Therefore, these two ratios are integral when looking at liquidity and funding of banks and the table below highlights the ratios across the banks from previous graphs:
S&P Capital IQ Pro is a premier source of in-depth data and analysis on financial institutions. We continuously work towards enhancing the offering and in a recent release in January we introduced liquidity coverage ratio composition data, which forms an essential component of supervisory approach to managing liquidity risk. The table below shows the break-down of the data points available for Banco Santander. One can see some useful metrics such as retail and counterparty deposits outflow, especially stable deposits that usually have a run-off rate of 3% and higher and less stable deposits that have a run-off rate of 10% and higher.
|
Liquidity Coverage Ratio composition ($): Banco Santander - 2022 year end |
|
|
Eligible Level 1 Liquid Assets |
325,424,816 |
|
Eligible Level 2A Liquid Assets |
3,526,771 |
|
Eligible Level 2B Liquid Assets |
3,847,387 |
|
Other High Quality Liquid Assets |
641,231 |
|
Retail And Counterparties Deposits Outflow |
46,997,969 |
|
Stable Deposits |
18,100,887 |
|
Less Stable Deposits |
28,828,684 |
|
Other Retail And Counterparties Deposits Outflow |
68,398 |
|
Unsecured Wholesale Funding Outflow |
142,852,410 |
|
Operational Deposit Outflow |
9,019,985 |
|
Non Operational Deposits Outflow |
124,776,103 |
|
Unsecured Debt Outflow |
9,057,390 |
|
Other Unsecured Wholesale Funding Outflow |
- |
|
Secured Wholesale Funding Outflow |
8,552,955 |
|
Additional Outflow Requirements |
48,394,785 |
|
Derivative Expo And Other Collateral Requirement |
21,256,813 |
|
Loss of Funding on Debt Products |
1,970,717 |
|
Credit And Liquidity Facilities |
25,167,254 |
|
Other Additional Outflow |
- |
|
Other Contractual Funding Obligation |
18,286,844 |
|
Other Contingent Funding Obligation |
9,908,090 |
|
Total Cash Outflow |
274,993,053 |
|
Secured Lending |
3,568,451 |
|
Inflows From Fully Performing Exposures |
49,665,491 |
|
Other Cash Inflows |
20,704,286 |
|
Total Cash Inflow |
73,939,297 |
|
High Quality Liquid Assets |
324,174,415 |
|
Net Cash Outflows |
201,053,757 |
My intention here is not to comment on individual banks, whether it’s well managed or not, and what the asset liability mismatch means for the banks. Rather, the intention is to illustrate how access to granular data is paramount to make informed decisions by the creditors, investors, regulators, or other parties that have vested interest in banks and the financial industry.
In addition to above, there are other topics that are on most people’s mind such as looking at bank failures over time, understanding systematic risks in global financial markets, stress test results, CDS movements etc. – topics that Capital IQ Pro can help you out with. If you’re already a subscriber of Capital IQ Pro, please reach out to your Relationship Manager to have a discussion on how to access above data and analysis. If you’re not an existing subscriber, please click on the link below to request a demo and someone will be in touch to enable you to make timely and informed decisions.
For existing Capital IQ Pro subscribers, please click here to access pre-built template on EBA Transparency Exercise for 2022 and another one for Bank Regulatory Capital analysis.
Footnotes:
Liquidity coverage ratio disclosure standards
Basel III: The Liquidity Coverage Ratio and liquidity risk monitoring tools