
Global markets are approaching new peaks in their economic recovery. In the U.S., continuous government stimulus payments and efficient vaccine roll-outs have further revived both supply and demand for goods and services. Although public companies began publishing financial reports for the second quarter of 2021, the results do not yet show the full extent of the global recovery, due to the intrinsic lag effect of financial performance. This is further confounded by the acceleration of the economy that is projected to grow at a stronger pace in Q2 2021. S&P Global Ratings’ macroeconomic forecasts expect a real GDP growth rate of approximatley 11% in the U.S., in addition to higher stock market indexes and lower unemployment.[1]
To help navigate these transition times, we have selected a major economy (the U.S.) and use S&P Global Market Intelligence’s Macro-Scenario model to analyze how the credit risk of public and private firms in the country may change under different macroeconomic projections.[2]
Macroeconomic Recovery Scenarios
While typical recovery periods may last for many years, the current macroeconomic environment is unprecedented in many ways. It is global, driven by a rapid evolution of supply and demand shifts, affected by government and monetary policies, and fast changing considering vaccine roll-out rates and the emergence of COVID-19 new variants. Thus, providing relevant and most recent macroeconomic projections can be challenging.
Figure 1 shows the trend of U.S. real GDP growth rate in 2021. GDP growth is expected to have reached its peak in Q2 2021, with a slowdown in subsequent quarters, eventually converging to a projected stable rate of approximately 1.89% in Q1 2022.
Figure 1: US Real GDP Growth Rate (in %)
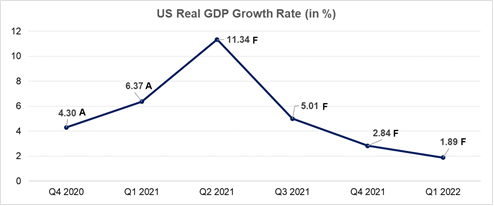
Notes: Quarterly percentage change represents annualized change over the period. “A” represents actual and “F” represents forecast.
Source: S&P Global Ratings Economist. As of March 31, 2021. For illustrative purposes only.
Table 1 shows macro factor values under different scenarios. We analyze multiple economic recovery scenarios to provide an overview of the range of possible outcomes, and gauge industry sensitivities to macroeconomic conditions.
We use Q4 2020 macroeconomic values as the baseline, and Q1 2022 macroeconomic forecasts developed by economists at S&P Global Ratings (as of March 2021) as the outlook, in order to demonstrate the trend of progressive economic recovery in 2021. Additionally, we include two positive stress recovery scenarios on top of the baseline, under the assumption of an “optimal” economic growth and supportive environment post COVID-19 for the first quarter of 2022.
Table 1: Macroeconomic Scenarios and U.S Real GDP Growth Rate
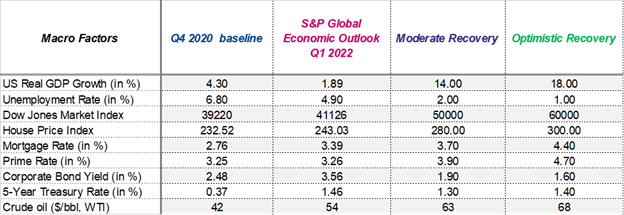
Source: S&P Global Market Intelligence. As of March 30, 2021. For illustrative purposes only.
Which Sector Will Recover the Most?
Figure 2 shows the public and private firms’ median credit risk by industry for the selected macroeconomic scenarios.[3] Credit scores for individual companies are generated via S&P Global Market Intelligence’s Probability of Default (PD) Model Fundamentals.[4] The degree of economic recovery in different industries is mostly driven by the characteristics of post COVID-19 positive macroeconomic projections.
Figure 2: Macro-Scenario Credit Risk Radar
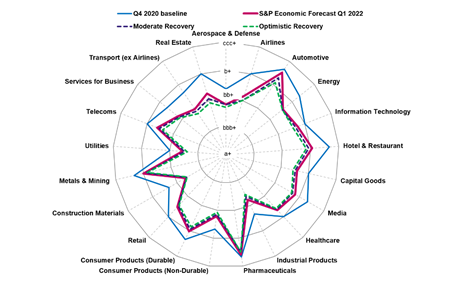
Note: Scenario output is after market adjustment to reflect the most recent market movements.
Source: S&P Global Market Intelligence. As of March 30, 2021. For illustrative purposes only.
For example, the expansion of infrastructure facilities positively affects the construction and industrial products industry. In addition, as companies regain confidence in the economy, they are expanding manufacturing capabilities by investing larger amounts of capital and increasing their labor force, thereby producing more goods. This, in turn, creates a virtuous cycle where production and consumption are both stimulated, increasing investment and decreasing unemployment. This will simultaneously affect upstream and downstream industries in a positive way. Energy, industrial products, and construction materials (upstream sectors), as well as retail and media industries (downstream sectors), exhibit the best recovery over the Q1 2022 outlook when compared with the baseline scenario. Meanwhile, as the majority of the population gets vaccinated and businesses fully reopen from lockdowns, consumers are expected to increase spending and traveling over time. This reflects a significant improvement in the credit risk profile ofr companies in the hotels & restaurants, airlines, and transport industries. The real estate and construction materials industries also show strong recovery and transition in credit risk, as more and more new construction is in place. In contrast, the health care and pharmaceutical sectors are relatively stable and resilient during both an economic recovery and recession.
Point-In-Time Market-Adjusted Default Rates
The Macro-Scenario model estimates the average tendency of companies in each industry to transition to a different credit score, under a given scenario. For each credit score, we map a long-term (LT) PD. However, the default rate associated with each credit score is expected to change, as well. To reflect this short-term (ST) aspect, the Macro-Scenario model incorporates a ST adjustment that reflects the current market pulse about the future credit risk evolution.[5]
Figure 3 shows the LT and ST assessment[6] of PDs mapped from the projected median credit score by industry, under an optimistic recovery scenario and after ST adjustment, for Q1 2022. We also report the LT PD associated with median scores for each industry under the Q4 2020 baseline.
Figure 3: Optimistic Macroeconomic Scenario: Long-Term and Short-Term PDs
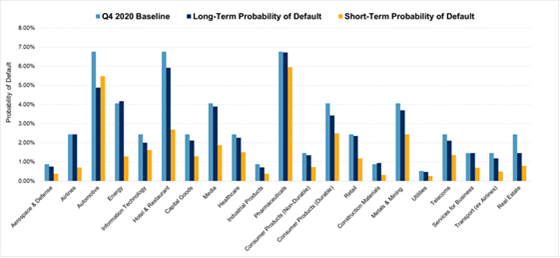
Source: S&P Global Market Intelligence. As of March 30, 2021. For illustrative purposes only.
As a result of the improving economic conditions, the LT PD (dark blue bar) slightly decreases, while the ST PD (yellow bar) significantly decreases across most industries. Proportionally, the top-three improved sectors include airlines, energy, and hotels & restaurants. Conversely, the information technology, pharmaceuticals, and healthcare industries show less improvement in ST PDs, potentially due to their historically observed resilience across the economic cycle. On the opposite side of the spectrum, the ST PD slightly increases for the automotive industry, due to disruption of supply chains and high inventory holding costs. The market-view for the recovery of this industry shows more twists and turns.
Additional Considerations
The current macroeconomic forecasts suggest that the degree of recovery varies across different industries. We notice that the recovery effect will be slightly larger for industries that entered this crisis with lower credit scores. It is thus prudent to analyze various macroeconomic scenarios to gauge the potential outcomes.
With most restrictions loosened and business opening, normal operations for many companies is starting to resume. Leverage and liquidity, debt maturity profile, operational flexibility, and the ability to access external capital will be important factors affecting the creditworthiness of companies. The wider economic, monetary, fiscal, and support policies adopted by governments will also shape a firm’s ability to get back on track from a credit risk perspective.
Copyright © 2021 by S&P Global Market Intelligence, a division of S&P Global Inc. All rights reserved.
These materials have been prepared solely for information purposes based upon information generally available to the public and from sources believed to be reliable. No content (including index data, ratings, credit-related analyses and data, research, model, software or other application or output therefrom) or any part thereof (Content) may be modified, reverse engineered, reproduced or distributed in any form by any means, or stored in a database or retrieval system, without the prior written permission of S&P Global Market Intelligence or its affiliates (collectively, S&P Global). The Content shall not be used for any unlawful or unauthorized purposes. S&P Global and any third-party providers, (collectively S&P Global Parties) do not guarantee the accuracy, completeness, timeliness or availability of the Content. S&P Global Parties are not responsible for any errors or omissions, regardless of the cause, for the results obtained from the use of the Content. THE CONTENT IS PROVIDED ON “AS IS” BASIS. S&P GLOBAL PARTIES DISCLAIM ANY AND ALL EXPRESS OR IMPLIED WARRANTIES, INCLUDING, BUT NOT LIMITED TO, ANY WARRANTIES OF MERCHANTABILITY OR FITNESS FOR A PARTICULAR PURPOSE OR USE, FREEDOM FROM BUGS, SOFTWARE ERRORS OR DEFECTS, THAT THE CONTENT’S FUNCTIONING WILL BE UNINTERRUPTED OR THAT THE CONTENT WILL OPERATE WITH ANY SOFTWARE OR HARDWARE CONFIGURATION. In no event shall S&P Global Parties be liable to any party for any direct, indirect, incidental, exemplary, compensatory, punitive, special or consequential damages, costs, expenses, legal fees, or losses (including, without limitation, lost income or lost profits and opportunity costs or losses caused by negligence) in connection with any use of the Content even if advised of the possibility of such damages.
S&P Global Market Intelligence’s opinions, quotes and credit-related and other analyses are statements of opinion as of the date they are expressed and not statements of fact or recommendations to purchase, hold, or sell any securities or to make any investment decisions, and do not address the suitability of any security. S&P Global Market Intelligence assumes no obligation to update the Content following publication in any form or format. The Content should not be relied on and is not a substitute for the skill, judgment and experience of the user, its management, employees, advisors and/or clients when making investment and other business decisions. S&P Global keeps certain activities of its divisions separate from each other in order to preserve the independence and objectivity of their respective activities. As a result, certain divisions of S&P Global may have information that is not available to other S&P Global divisions. S&P Global has established policies and procedures to maintain the confidentiality of certain non-public information received in connection with each analytical process.
S&P Global Ratings does not contribute to or participate in the creation of credit scores generated by S&P Global Market Intelligence. Lowercase nomenclature is used to differentiate S&P Global Market Intelligence PD credit model scores from the credit ratings issued by S&P Global Ratings.
S&P Global may receive compensation for its ratings and certain analyses, normally from issuers or underwriters of securities or from obligors. S&P Global reserves the right to disseminate its opinions and analyses. S&P Global's public ratings and analyses are made available on its Web sites, www.standardandpoors.com (free of charge) and www.ratingsdirect.com (subscription), and may be distributed through other means, including via S&P Global publications and third-party redistributors. Additional information about our ratings fees is available at www.standardandpoors.com/usratingsfees.
[1] S&P Global Ratings Economists Forecast, as of March 2021.
[2] For further information, see S&P Global Market Intelligence: “Macro-Scenario Model”, White Paper, December 2019.
[3] S&P Global Ratings does not contribute to or participate in the creation of credit scores generated by S&P Global Market Intelligence. Lowercase nomenclature is used to differentiate S&P Global Market Intelligence PD credit model scores from the credit ratings issued by S&P Global Ratings.
[4] S&P Global Market Intelligence: “PD Model Fundamentals - Public Corporates”, White Paper, February 2020; S&P Global Market Intelligence: “PD Model Fundamentals – Private Corporates”, White Paper, February 2020.
[5] This adjustment is based on PD Model Market Signals (PDMS), a structural market-driven model that leverages stock price and volatility information of publicly listed companies to estimate a PD. Please refer to S&P Global Market Intelligence: “PD Model Market Signals”, White Paper, September 2019 for more details.
[6] The ST adjustments are calculated using median benchmark PD levels generated by PDMS in the last three months versus the last year.