
This is the second in a series of three blogs on risk trends.
In our first blog, we analyzed the impact of the COVID-19 pandemic on the probability of default (PD) of non-financial corporates based in the Middle East, Africa, India, Turkey, and other emerging economies in Europe and Asia. We saw that the average PD of our study sample, based on year-end 2020 financial statements, stood at 12.7% compared to 9.7% against the year-end 2019 financial statements. Measuring the PD of a corporate is a crucial element in the credit risk assessment exercise undertaken by a financial institution or an investor, however, it is not the only aspect that is assessed. Equally important is the severity of the loss if the borrower defaulted, often referred to as LGD. LGD is an estimate of the portion of an exposure (bond or loan equivalent) that will likely not be recovered in the event of default.
Calculating LGD
In this blog, we utilize the S&P Global Market Intelligence LGD Scorecard, which is designed to estimate LGD at the exposure level (i.e. facility level), and produces estimates of loss which are point-in-time (PiT), reflecting current economic conditions. This feature captures the fact that default during an economic downturn is typically accompanied by lower recoveries. We forecasted LGD for 3,588 entities from the original sample used in our first blog, and found that the average LGD was 37% when measured against the year-end 2020 financials. The average LGD is slightly lower than the 45% rule accepted and used by various financial institutions globally.[1] In Figure 1 below, we display the distribution of the LGD results across six buckets. The first bucket (0%-10%) is for those entities associated with a minimal loss, should they default, while the last bucket (90%-100%) is for those entities associated with a maximum loss. Interestingly, most of the entities from our sample are located between the first bucket (low loss) and the fourth bucket (high loss), which is in line with the empirical bimodal character of observed recoveries. Uncoincidentally, it is the expectation that an LGD distribution should have a bimodal characteristic that drove institutions and regulators to accept the 45% rule for LGD. Taking the distribution in Figure 1 as an example, we find that a 45% rule is underestimating or overestimating most cases in our study.
Figure 1: LGD distribution
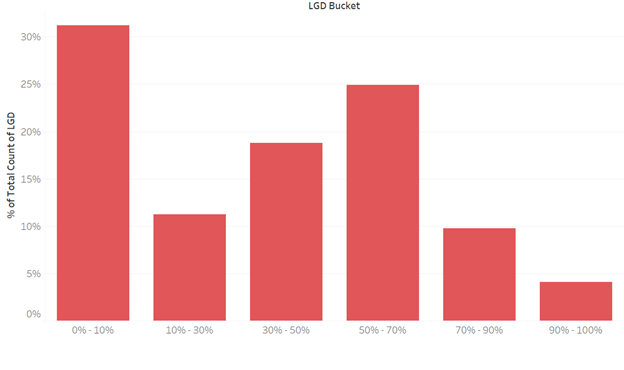
Source: S&P Global Market Intelligence corporate LGD scorecard, as of 31 March 2021. For illustrative purposes only.
A high PD doesn’t necessarily lead to a high LGD. The loss that an investor sustains from a position is driven by several factors and, often, the initial creditworthiness of an entity is not a crucial dynamic. Rather, the loss is driven by other considerations, such as the economic value of the business, the seniority of the exposure, the reliability of the jurisdiction governing the recoverability of a transaction, and/or the collateral. This PD/LGD dichotomy is visualized to an extent in Figure 2 below. We see Energy-based corporates having the highest average LGD, at 60%, which aligns with the PD ranking we saw in our first blog with Energy-based corporates having the second-highest average PD when measured against the year-end 2020 financials. We see Utilities having an average LGD of 50%, although Utilities had the lowest PD in the analysis in our first blog. Looking at PD and LGD separately can be useful and is recommended, however, combining the two views is what completes the study. We will do this in our third blog where we look at Expected Loss.
We had to make some assumptions to perform this LGD study. Chief amongst them was the assumption that each exposure is senior unsecured and that all liabilities of each entity are ranking pari-passu to each other. In other words, the bank holding a bond/loan issued by one of these entities is going to have a claim against the assets of the entity, should it default, that is equal to the claim of other liability holders (including non-financial liabilities). The LGD model takes into consideration various factors, as reflected above and further expanded upon in the “Models and Methodology” section below. We attempt to show how one key factor impacts the LGD, which is the LGD cushion that an entity exhibits. The LGD cushion is the amount of capital that acts as loss-absorbing capital before the investor/lender’s position is impacted by default of a borrower. Those entities with higher loss cushions should show a higher recovery and lower loss. We measure the LGD cushion by the entity’s equity/assets. In Figure 3 below, we plot all the sampled entities according to their LGD cushion on the X-axis, and LGD % on the Y-axis. The model provides a higher LGD for those entities with a lower loss cushion, and vice versa.
Figure 3: LGD Cushion
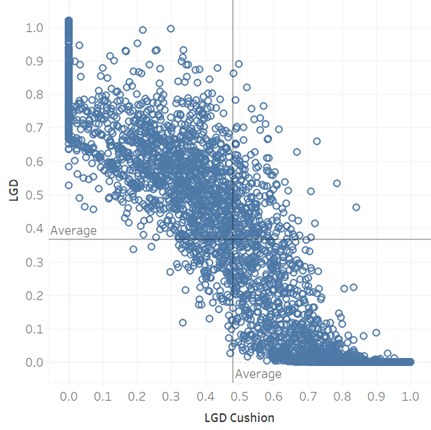
Source: S&P Global Market Intelligence corporate LGD scorecard, as of 31 March 2021. For illustrative purposes only.
Models and Methodology Explained
Our LGD Scorecards were constructed over 20 years ago to estimate LGD at the exposure level. We believe that LGD should be conditional on explanatory variables and exposure specifics, resulting in a more reliable facility- or bond-specific PiT estimate of loss for any exposure, secured or unsecured. To achieve this, we undertook extensive research to identify possible explanatory variables, placing equal emphasis on both qualitative and quantitative factors. We identified six drivers of loss:
- Pre- and post-default quantity and riskiness of cash flow/assets/economic value.
- The seniority of exposure (e.g., a senior bond).
- Jurisdiction.
- Economic expectations.
- Collateral and guarantees/insurance.
- Recovery costs and workout policy (restructuring versus disposal).
These factors were further refined for sovereign-specific elements, including post-default expectations of support (e.g., bilateral or multilateral), expectations of post-default economic/political stability, and historical default experience. The final Scorecard inputs – which include a combination of macroeconomic, fiscal, and market indicators – were selected based on the ease of availability of forecast data.
Figure 4: LGD Scorecard flowchart
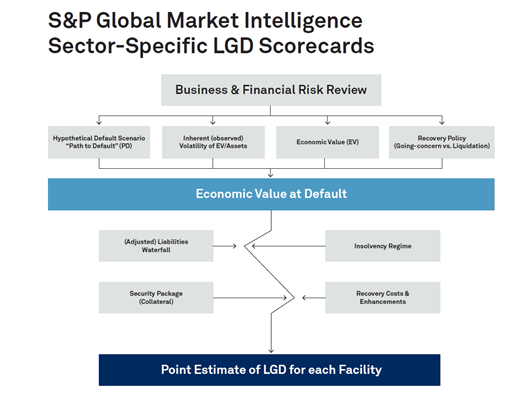
Source: S&P Global Market Intelligence corporate LGD scorecard, as of 31 March 2021. For illustrative purposes only.
Click Here for more information on our LGD Scorecards.
[1] Senior claims on corporates, sovereigns and banks not secured by recognized collateral attract a 45% LGD.