
Increasingly, financial professionals are faced with the challenge of managing the vast amounts of data available to them, and more importantly, synthesizing insights from it to make informed decisions. To solve this, they often seek interactive platforms with data visualization tools to better understand their data and identify new opportunities for investment. As a provider of these solutions, S&P Global Market Intelligence was looking to enhance the S&P Capital IQ Pro platform with a new charting solution that would give their customers more advanced analytics and stronger data visualization, and ultimately support more complex workflows.
Previously, Market Intelligence leveraged a generalized third party graphics library as the foundation for their charting. This solution met the basic needs of customers but had certain limitations. Specifically, they found that their users were looking for more interactivity, more options for personalization, and a stronger user interface that could support the increasingly advanced workflows required of financial analysts.
In January of 2023, Market Intelligence not only acquired ChartIQ, but they began immediate work to integrate their advanced charting solution into the Capital IQ Pro platform. In three short months, they were able to release the upgraded tool and quickly turn around new value for their customers.
Pain Points
Market Intelligence's existing charting solution needed to meet the needs of modern financial use cases, enabling end users to conduct thorough and comprehensive analysis of complex data. Specifically, their customers needed:
- Sophisticated dataset integration and access — Customers often need to combine data that is intricate and multifaceted. They need rich visual solutions that allow the comparison of data metrics through time and across an array of related entities, such as a portfolio or watchlist. The data can then be displayed using time series and cross sectional visualizations such as curves and scatter plots to effectively identify and convey complex relationships and patterns using their visualizations. Individuals seek the capability to customize their solutions according to their workflow preferences, enabling them to gain enhanced insights into their strategic initiatives.
- Robust interactivity — Dynamic interaction such as zooming in and out, drawing tools, or hovering over data points for additional information is essential for the financial professional. Limited interactivity makes it difficult for users to explore and analyze data which inhibits market insights and productivity
- Advanced personalization — Customers desire the ability to personalize the appearance of their charts, making it easier to change colors, fonts, and styles to match their brand or tailor charts to their specific needs. The lack of personalization results in diminished accessibility and creativity, as individuals operate with varying work styles and proficiency levels.
Overall, Market Intelligence customers required a more advanced and sophisticated charting solution that would allow them to interact with data in dynamic ways and customize their charts to their specific requirements.
"The addition of ChartIQ to our S&P Capital IQ Pro platform brings together comprehensive data and workflow with compelling analytical capabilities and advanced charting.” — Warren Breakstone, Head of Desktop and Channel Solutions at S&P Global Market Intelligence
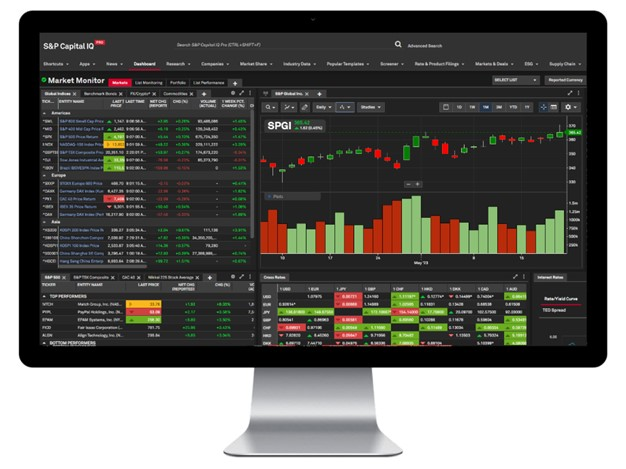
Figure 1 - Capital IQ Pro dashboard featuring the ChartIQ widget.
The Solution
ChartIQ is a modern, professional-grade charting solution that allows customers to visualize data with an interactive, web-based chart library that works seamlessly across web, mobile, and desktop. It's sleek, industry-leading interface is built upon finance-based workflows like trade visualization, options analytics, and technical analysis, and allows customers to visualize their own proprietary or alternative content alongside vendor-supplied data.
After ChartIQ was acquired by Market Intelligence, both development teams began work to quickly release the new charting solution into S&P Capital IQ Pro, Market Intelligence's primary desktop solution. Their goal was to complete the work in 3 months, and for the size of the implementation, this was a breakneck pace that was only achievable through close coordination and quick response times.
The implementation came with its challenges. Being a complicated and highly technical platform, Capital IQ Pro had specific requirements for implementation that often obligated the ChartIQ team to make fast changes and build in new requirements, but they successfully rose to the challenge and quickly moved past roadblocks.
The ChartIQ solution has enabled data within the Capital IQ Pro platform to be more accessible, actionable, and meaningful. It supports the complex workflows of customers, helping them identify trends, optimize processes, and drive better business outcomes.
|
|
Bring any dataset to life with interactive graphic displays. |
|
|
|
Provide technical analysts with a professional-grade charting solution. |
|
|
|
Leverage a full suite of real-time graphics and analytics tools. |
|
|
|
Create linked graphic displays through cross-section plots to visualize term structure, options analytics, and scatterplots. |
|
|
|
Visualize an event spanning time and analyze the impact of each relevant data point on market activity. |
|
Key Benefits
ChartIQ helps customers move from traditional relatively static charts to a rich fully interactive custom data visualization that intuitively explains and engages customers with actionable, tradable data. This premier charting solution brings complex data sets to life for all sectors of finance through a professional-grade HTML5 charting library that works seamlessly on any platform (mobile, web, desktop) or framework (Angular, React). It is pure JavaScript and runs entirely within a web browser. Most companies have at least one financial charting library for each platform or application they target—web, C#, Java, Android, iOS, etc. which means developers must maintain multiple code bases. With ChartIQ, developers can code once and use it everywhere. Additionally, S&P Global Market Intelligence immediately found value in the following:
- Finance-first UI. Financial professionals expect their graphic solutions to be highly interactive so that they can compare and contrast data sets to drive their decision-making process. This is complicated by the unique nature of financial market data and the user interface challenges created by market complexities like time zones, market sessions, lunch hours, market holidays, etc. As a specialist in financial visualization ChartIQ has addressed these corner cases and others allowing the application developers to focus on the larger business objectives.
- Support for technical analysis and complex workflows. ChartIQ brings a state-of-the-art technical analysis solution to S&P Capital IQ Pro providing users with a significantly expanded analytical toolkit allowing clients to augment traditional fundamental analysis with a technical viewpoint. Clients can now draw and annotate their charts, as well as apply over 125 studies or use new chart display types. Certain technical analyses can be time-consuming. ChartIQ’s sophisticated solution is built specifically for modern and complex financial workflows.
- Fully customizable + quick time-to-market. ChartIQ drop-in UI templates make it easy to install a financial chart in a matter of hours, and “light” customization such as specific UX or brand requirements can be done with minimal effort. When a client wants to build an entirely new UI to supply a proprietary UX and/or a complete trading platform, ChartIQ is the industry leader. Our purpose-built SDK, injection API, extensive documentation, and US-based customer support help customers create a fully customized platform to fit their business-specific needs. ChartIQ makes it easy for financial institutions or retail vendors to install a powerful interactive graphic display to show data—simple and straightforward. But for those that might need sophisticated charts to satisfy power users and advanced traders, we have customization options. Whatever the level of user, ChartIQ's modular product can adapt.
- Best-in-class developer experience. Development teams are in good hands with white-glove support, tools, and documentation to quickly release a customized solution. ChartIQ supports multiple JS development frameworks such as React, Angular, and Vue. With partner-level guidance from our US-based Client Success team, developers can share code snippets and get advice on implementation directly from the team who created and maintain the product. Regular upgrades mean charts will always be compatible and include the most up-to-date functionality. The ChartIQ library performs this analysis by applying formulas to data stored in the chart object’s dataset. The formulas exist, and results are calculated, within the library itself. This means that all computations are performed in the client’s browser.
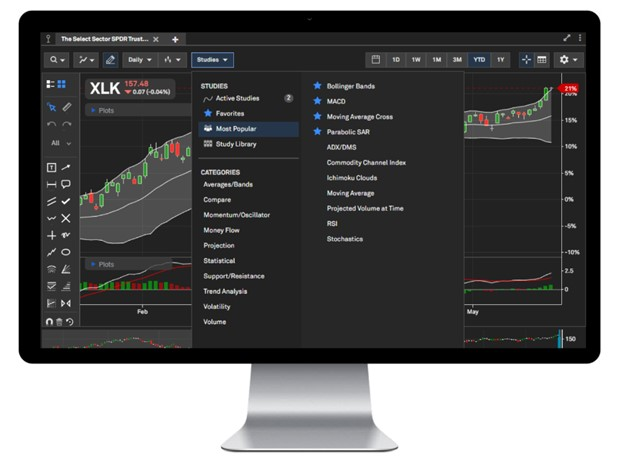
Figure 2 - ChartIQ's UX capabilities.
ChartIQ provides traders and investors with advanced financial charting and technical analysis tools for data-driven decision-making. Click here to learn more about the ChartIQ solution.