In insurance terms, the Solvency and Financial Condition Report (SFCR) insurance disclosure appeared relatively recently in 2018. It is organized by the European Insurance and Occupational Pensions Authority (EIOPA) with individual insurance companies publishing the results. A lot of interesting analyses can be done using this dataset.
SFCR provides standardized data, primarily on the capital position of the insurance entity. It also provides information on the insurance entity’s lines of business and geographic operations. This information is often provided in investor presentations, but in a format that is unique to the company and hence difficult to aggregate and compare, at least without analyst input. In many ways, it is similar – though relatively limited in scope – to the data collected in the US National Association of Insurance Commissioners (NAIC) dataset, which is also provided on the S&P Capital IQ Pro platform.
The S&P Capital IQ Pro platform contains the full suite of SFCR data for ~2,500 entities, which can be used to estimate country-level market share and a company’s geographic operations. Teams that can benefit from this data include:
- M&A Teams can explore the impact of mergers on market share or search for fragmented markets.
- Insurance Head Offices can establish competitors, potential new markets, and explore M&A.
- Central Banks & Consultancies’ regulatory teams can examine potential market share concentration.
To simplify this analysis, an automated custom model can be built. First, let’s take a look at the data available. Below is a screenshot of the geographic data on the S&P Capital IQ Pro desktop.
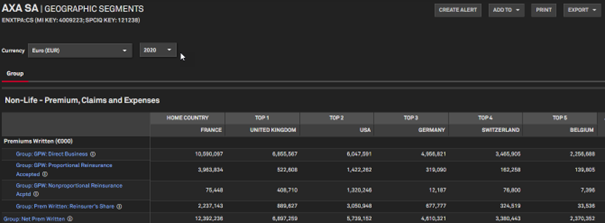
Figure 1 - Example of geographic data available on the S&P Capital IQ Pro desktop.
You can see in total there are six countries recorded. It is also worth noting that this is ‘Group’ data. Companies can report either as a ‘Solo’ entity or at a ‘Group’ level, or sometimes both. Group data should ideally reflect the ultimate parent’s features, though there could be variations in reporting. The data above – SFCR Group at the ultimate parent level (e.g., Axa Group) –looks highly reliable. It can become more complex with companies where the ultimate parent does not report SFCR data. Often, these are companies based in the US or Switzerland.
Let’s look at an example. Shown below is a model which processes all of our SFCR data, tidying it where necessary and clustering the entities by the ultimate parent. The model is fully automated – allowing any EU country to be entered and the data refreshed. This is is an output for the UK:
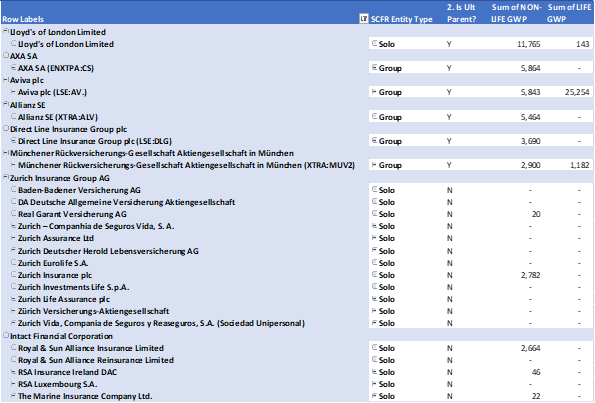
Figure 2 - Model results for United Kingdom. Source: S&P Capital IQ Pro.
The results are grouped by the ultimate parent company, and the data ranked by the sum of the Non-Life Gross Written Premiums (GWP), a measure of insurance revenue for that group. In the majority of cases, you can see the model simply takes the Group data from the ultimate parent, which is the most reliable analysis. It should be noted that Lloyds of London publishes only Solo data. This is not clear from the SFCR report itself, but the excerpt below suggests it is the right data (as well as the size of the numbers).
Overall, the SFCR aggregates the results and resources of the Society and its members. The SFCR may, therefore, be used as a reasonable presentation of the results and state of affairs of the Lloyd’s market on a basis that is as closely as possible comparable with general insurance companies.
Zurich Insurance Group is domiciled in Switzerland which does not publish SFCR data. However, many of its subsidiaries publish data. Only two of these have data for the UK (or are domiciled there). This data may be less representative – Zurich Insurance Group may write business in the UK from entities domiciled in Switzerland – and at best be considered an estimate. In this type of case, we are aggregating the available Solo level data to provide an estimate.
Interestingly, Zurich Insurance Group is domiciled in Dublin, Ireland, a territory/country which is known for its attractive corporate tax rates. However, the vast majority of its business is outside the UK.
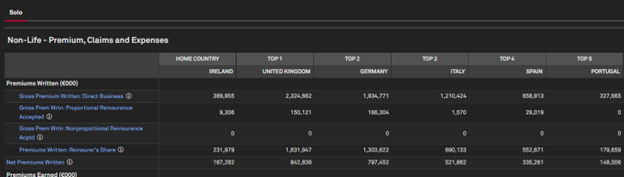
Figure 3 - Zurich Insurance plc (Dublin-based subsidiary of Zurich Insurance Group). Source: S&P Capital IQ Pro.
This highlights an important distinction between this analytical approach and other S&P Global templates and studies which use domicile of entity as the starting point. The above analysis shows how much business is being written in Ireland and the UK, not just where companies/entities are domiciled.
At this time, the general methodology for the model is as follows.
- Group all the reporting SFCR entities by their ultimate parent.
- Take the Group or ultimate parent data where available. Use largest if more than one.
- If no Group data is available, take the Solo level data for the entities.
- If an entity doesn’t publish geographic data, it is assumed it writes all of its business in the country of domicile. This is an option within the model.
- Eliminate subsidiaries of other SFCR entities to avoid duplication. We check to three levels.
- Sum by chosen metric (e.g., Non-Life GWP) for each group.
We are looking to improve this methodology further and look forward to receiving your feedback. As mentioned, although many of the components of the market share analysis – e.g., ultimate parent and Group SFCR data – look highly reliable, some are estimates.
Despite the challenges, the results are still of practical use and can save analysts hours of manual consolidation and review.
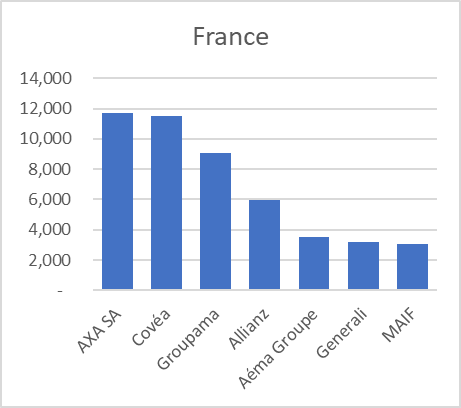
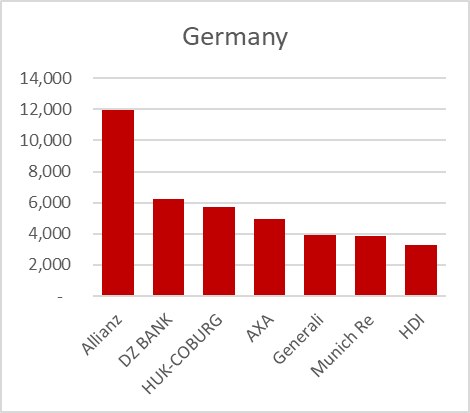
|
Example market share estimates (Non-Life GWP EURm) |
|
|
|
|