
On August 7 Panjiva’s research team held a webinar on the topic “The Global Trade War’s Impact and Road Ahead for Supply Chains“, based on Panjiva’s research of July 1, 2019. An on-demand recording is available here while this report addresses questions that were asked by webinar participants.
Several of the questions related to the economy more broadly, for which we would refer readers to coverage by S&P Global Ratings’ Economics available on the Market Intelligence platform here (client-only access). For a free sampling of our coverage on the impacts of global trade tensions, visit our global trade topic page.
How long do you think tariffs and retaliatory actions will stay in place?
We asked the webinar’s audience how long they expect the current situation of trade conflict between the U.S. and China will last. The vast majority of respondents – 63.8% of 130 survey respondents – expect it to last beyond 2020.
That’s perhaps not a surprise that there’s an increasingly hawkish stance towards China among Democratic Party candidates for President as well as from the Trump administration. The next biggest cohort of 26.9% expect a resolution before the next U.S. Presidential elections in Nov. 2020 while less than 10% expect an end to hostilities this year.
THE TRADE WAR’S HERE TO STAY
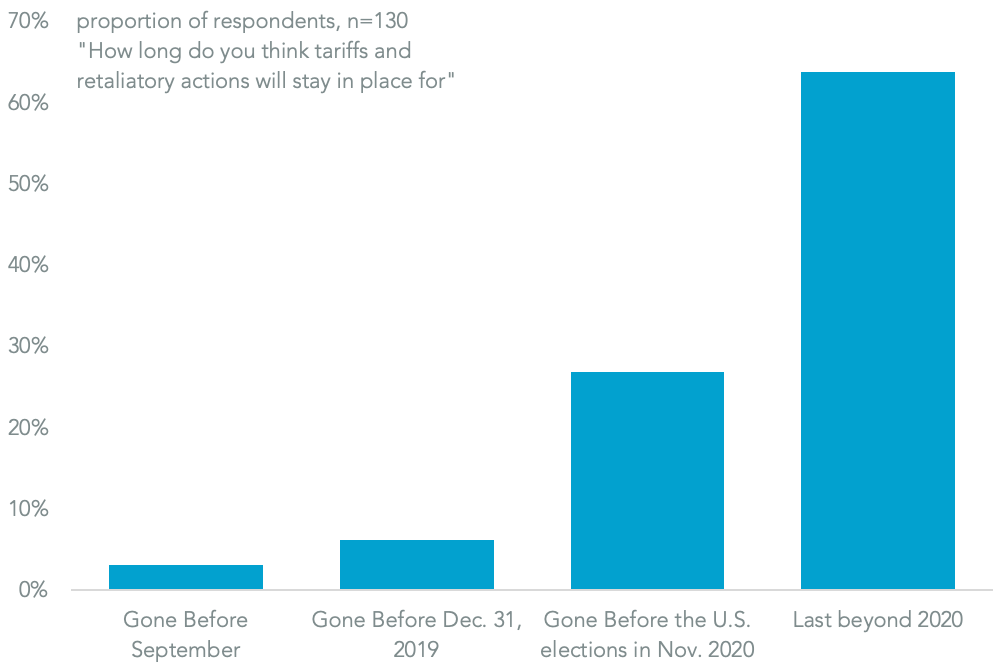
Chart shows polling responses regarding the outlook for U.S.-China trade conflict. Responses based on webinar held by S&P Global Market Intelligence on August 7, 2019. Source: Panjiva
Will the latest round of tariffs have an impact on the holiday shopping season?
Most companies have, and likely will, use price increases as a route for offsetting tariffs. Those will be particularly visible during the holiday shopping season given that most of the “list four” products cover consumer goods. There may even be an impact on the closer “back to school” season though peak imports for those products has already passed.
There’s already evidence of accelerated imports to create stockpiles ahead of the shopping season – partly reflecting concerns following an earlier breakdown in talks in May. Panjiva data shows U.S. imports of laptop computers and toys from China surge 32.5% and 16.2% respectively year over year in June. A 58.2% slump in videogame imports may reflect the absence of a lack of new models rather than weaker underlying demand.
LAPTOPS LOADING UP, VIDEOGAMES SHUTTING DOWN
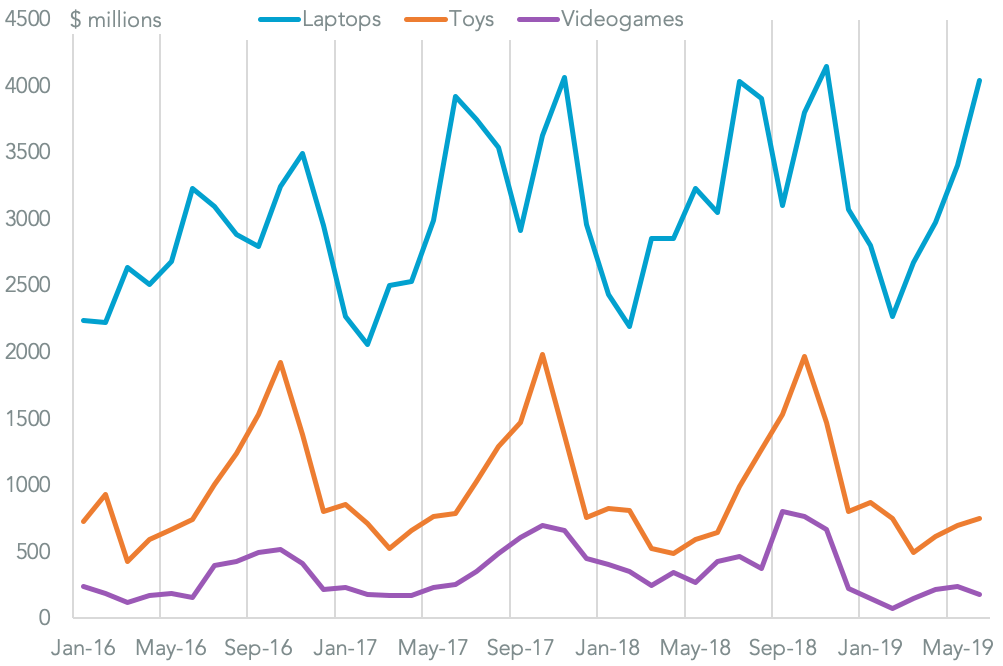
Chart compares U.S. imports from China of laptops, toys and video games. Source: Panjiva
What are the sort of “non tariff measures” that China can use?
The recent devaluation of the yuan is arguably a reaction to increased tariffs – the 2.5% depreciation in the two days after the Trump administration’s announcement of tariffs may have offset as much as half of the list four tariff impact. Yet, the devaluation appears to be a normal market reaction to reduced competitiveness.
More direct actions are possible. In particular the use of a so-called “unreliable entities” list formulated by the government with unspecified sanctions is an increasing risk for U.S. companies. The importance of state-owned-enterprises (SOEs) in the Chinese economy also allows the government to more accurately direct retaliation – most recently in regards to purchases of U.S. agricultural products.
The latter is illustrated by U.S. exports of agricultural and energy goods. In June 2019 exports of soybeans – a “goodwill product” designed to encourage a rapprochement with the Trump administration – to China from the U.S. jumped 496% year over year while imports of other agricultural products rose 10.5%. In the energy sector meanwhile imports fell 59.1%, likely due to China’s increasing imports from Iran.
SOYBEAN IMPORTS BETTER THAN LAST YEAR, BUT STILL WELL DOWN VERSUS THE PAST
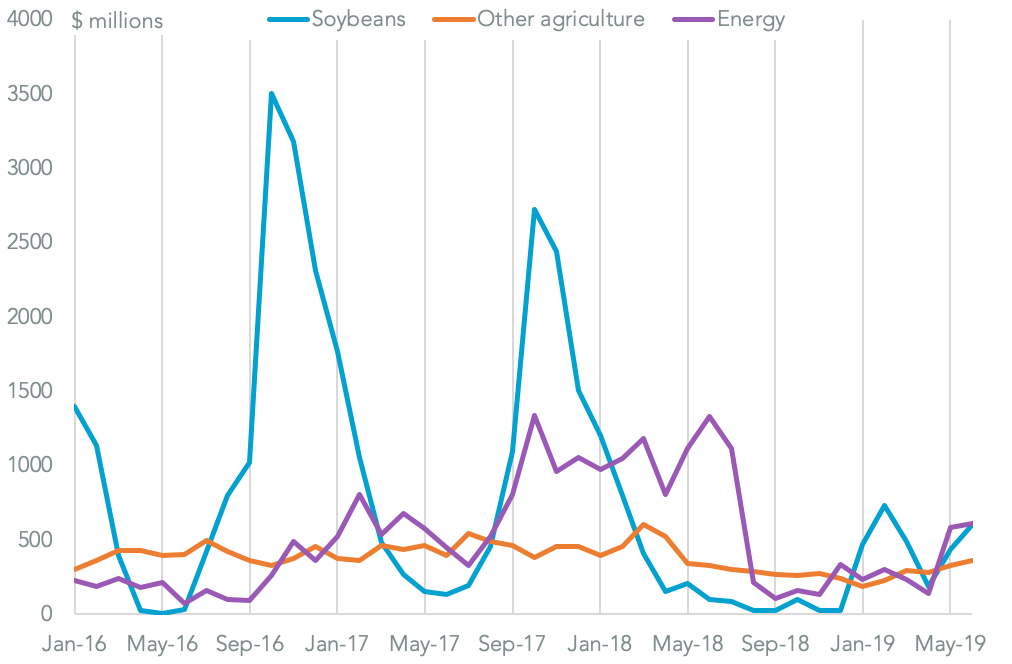
Chart segments U.S. imports of products from China afflicted by section 301 tariffs by product. Source: Panjiva
Is President Trump’s intent to force as much manufacturing as possible back to the U.S.?
President Trump was elected in part on a commitment to return manufacturing jobs to the United States, and his administration’s tariff-led policies can be partly seen through this lens. That doesn’t mean, however, that corporations have forsaken Chinese manufacturing in favor of the U.S. Indeed, one of the impacts of tariffs have been to accelerate existing plans to move supply chain bases to other, low-labor cost economies.
In the short-term there appears to have been more of a shift in U.S. imports to other countries rather than to the U.S. Panjiva data for U.S. seaborne imports shows that shipments of containerized freight from China fell 5.5% year over year in the three months to July 31, while those from the rest of the world climbed 5.4% with the result that total imports were unchanged.
IMPORTS FROM CHINA BEING OFFSET BY THOSE FROM OTHER COUNTRIES
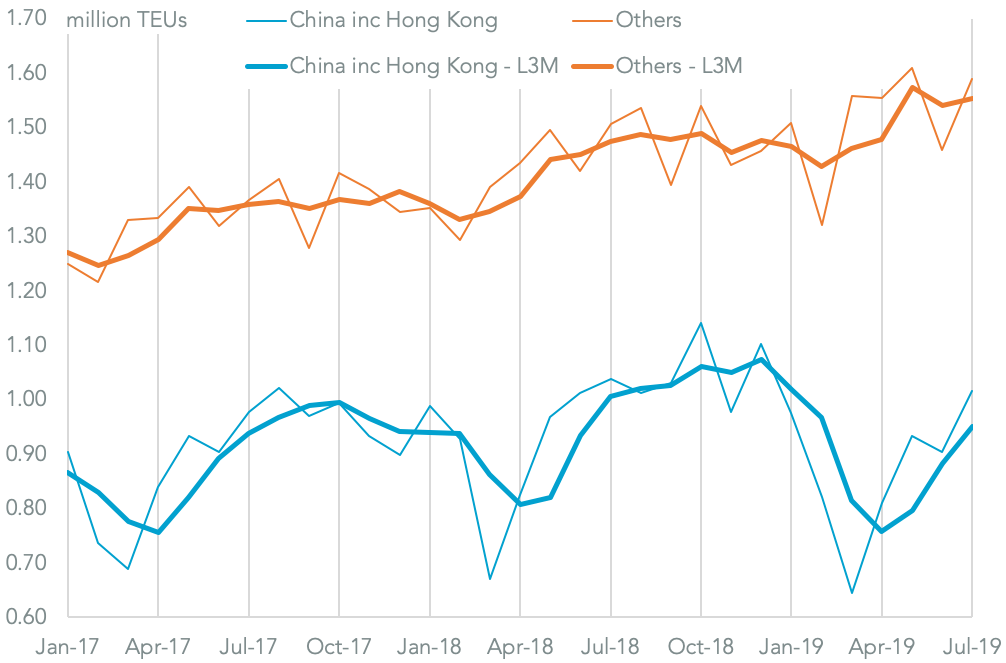
Chart segments U.S. seaborne imports by origin on a monthly and three-month average basis. Source: Panjiva
Are you seeing evidence of tariff evasion – particularly using shipments via third countries?
Malfeasance is often hidden, but there are legitimate routes such as the “first sale” rule that can be observed in Panjiva’s data. That allows companies to ship products from China to Mexico and then onward from Mexico to the U.S. in order to optimize their tariff payments. The perception of evasion can be as important as whether it actually occurs.
The Vietnamese government is in particular concerned about that phenomenon, with the Prime Minister – Nguyen Xuan Phuc – ordering customs agencies to clampdown on illegitimate transshipment. That in part relates to worries that the accelerating Vietnamese trade surplus versus the U.S. will draw a tariff-led policy response. Vietnam’s exports to the U.S. surged 27.2% year over year in 2Q while imports rose by just 5.1% with the result that the 12 month trailing trade deficit of $47.92 billion reached a record high.
VIETNAM’S GROWTH AS A SUPPLIER HAS BEEN 10 YEARS IN THE MAKING
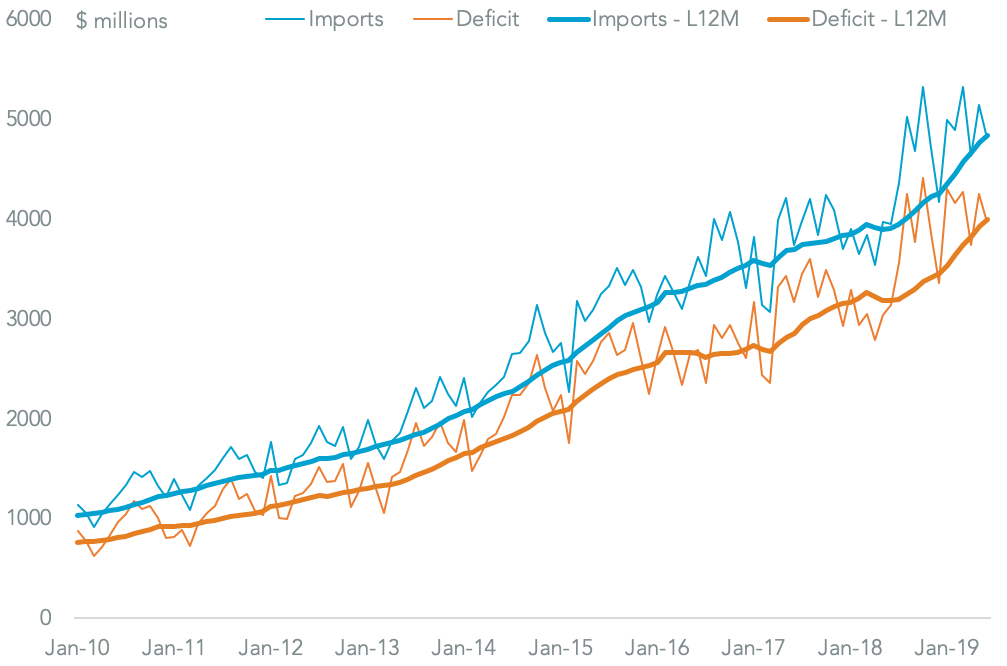
Chart compares U.S. imports from Vietnam to the merchandise goods deficit versus China on a monthly and 12-month average basis. Source: Panjiva
What are the prospects for Pakistan arising from the trade war?
President Donald Trump has already indicated a desire to increase trade with Pakistan four-fold. That doesn’t necessarily mean that Pakistan will benefit immediately – it may potentially need a trade deal to achieve that aim, which in turn will require Trade Promotion Authority in the U.S. and that has yet to be secured.
That may allow growth from products outside the traditional groups of apparel and textiles which accounted for $2.80 billion of U.S. imports in the 12 months to June 30, or 72.8% of the total.
DIVERSIFICATION AS WELL AS A TRADE DEAL NEEDED TO BOOST PAKISTAN’S EXPORTS
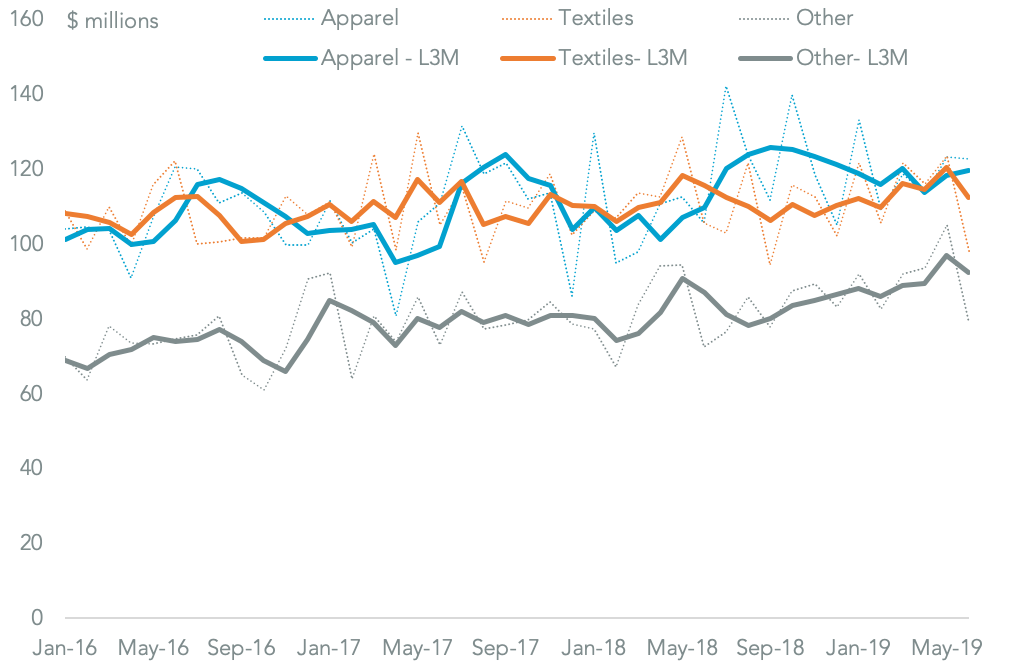
Chart segments U.S. imports from Pakistan by production on a monthly and three-month average basis. Source: Panjiva
Will the trade issues between the U.S. and China have a knock-on effect for other trade deals?
Yes, in two material ways. First is in encouraging China to pursue trade deals with other countries in order to build its influence within the global trade order and diversify its export markets. A prime example is the Regional Comprehensive Economic Partnership (RCEP) which includes Japan, South Korea, and India, as well as China and the ASEAN region. Yet, that deal is unlikely to make progress in 2019 due to the geopolitical spat between Japan and South Korea.
The latter also illustrate the second knock-on effect – namely that the Trump administration’s use of trade policy as part of wider geopolitical objectives has normalized such behavior. That arguably has been emulated in Japan’s move to restrict exports of semiconductor chemicals to South Korea, as well as remove South Korea’s trusted counterparty status.
Such a move has come despite the slowdown in exports in the region, with 12 of the 14 Asia-Pacific countries that have reported export figures for June having seen a year-over-year drop in exports, Panjiva analysis of S&P Global Market Intelligence figures shows (client-only access).
WIDELY COORDINATED DOWNTURN ABOUT MORE THAN JUST THE TRADE WAR
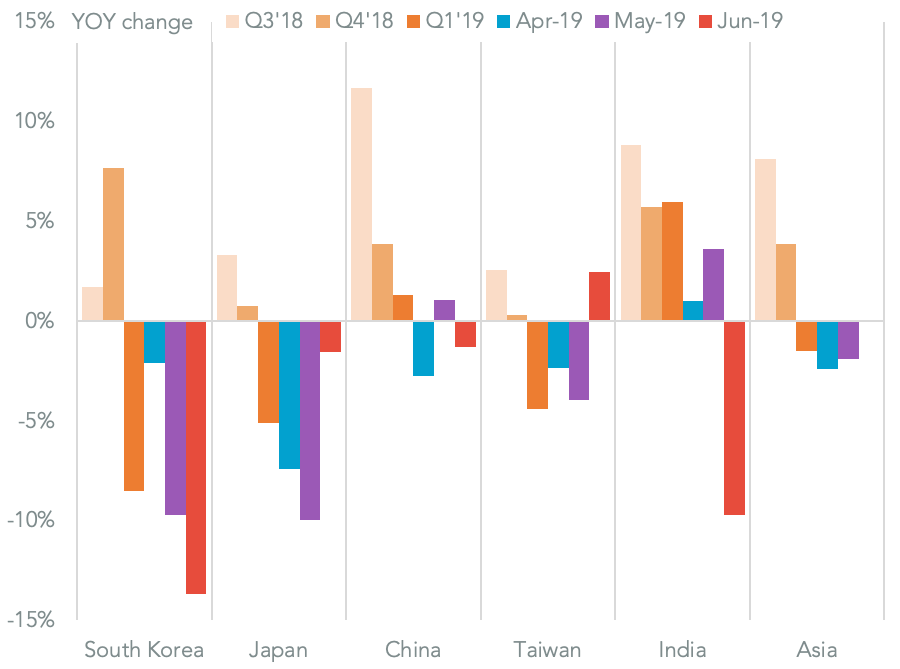
Chart segments exports by origin. Calculations based on S&P Global Market Intelligence data (client-only access). Source: Panjiva