
Loss Given Default (LGD), often the term used to refer to an investment’s ‘loss severity’, estimates the portion of an exposure (bond or loan equivalent) that will likely not be recovered in the event of default. When it comes to estimating the LGD of financial transactions, various techniques can be applied. In this blog, we discuss three methods: (1) a qualitative scorecard approach, (2) a quantitative statistical approach, and (3) an innovative market-implied approach.
It is widely accepted that data on loss (and recovery) rates are scarce and difficult to find. This is especially the case for what is typically called a Low Default Portfolio (LDP), which includes non-financial corporates (NFCs), financial institutions, sovereigns, and project finance. In this blog, we focus on NFCs where the scarcity of data can be attributed to many factors. NFCs do not default very often. When a default does occur, the event and the resulting loss and recovery have to be recorded, and this typically takes years to complete.
A Look at Default and Recovery Data
At S&P Global Market Intelligence, we have built a database of defaults and loss rates dating back to 1981, which is called CreditPro®. We used this data for recovery statistics on 7,836 transactions. Figure 1 below shows the data grouped in six different loss-severity buckets. The first bucket (0%-10%) is for those securities which experienced minimal losses, while the last bucket (90%-100%) is for those securities that experienced maximum losses. Figure 1 shows that the distribution of losses demonstrates a clear bi-modal characteristic, meaning that the most likely loss from a defaulted transaction is going to be very low or very high. It is no surprise, accordingly, that regulatory LGD is assumed to be 45% by various financial institutions globally since it is based on the average of such a bi-modal distribution. In addition, losses could fall in any bucket, meaning that a 45% average could lead to under-provisioning or over-provisioning against losses, both of which do not facilitate the optimization of capital allocation.
Figure 1: Observed Losses from Defaulted Transactions
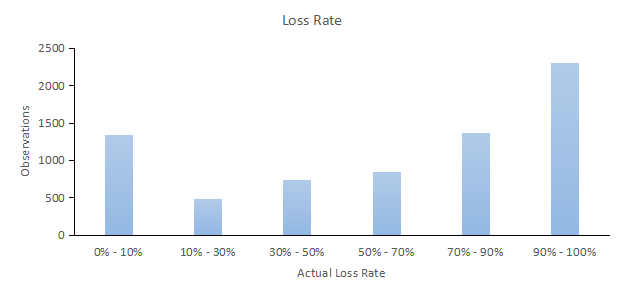
Source: S&P Global Market Intelligence CreditPro, as of March 31, 2022.
Assessing Three Methods for Uncovering LGD
Scorecards and statistical approaches for LGD calculations are offered by S&P Global Market Intelligence. To compare these, we identified data on 6,500+ issuances by 2,000+ issuers. The issuers were based in emerging markets across the Middle East, Africa, India, South America, APAC, and Europe. They were also from various industries, although the financial industry was excluded to maintain consistency of results and comparability of inputs, given the industry’s unique features. Each transaction was assessed with these two LGD approaches, as well as the third method to find the market-implied LGD.
Method 1: Scorecard Approach
S&P Global Market Intelligence has built an LGD Scorecard that produces estimates of loss based on a fundamentally driven methodology. This Scorecard is designed to estimate LGD, which is a point-in-time (PiT) estimate reflecting current economic conditions and capturing the fact that default during an economic downturn is typically accompanied by lower recoveries. The LGD Scorecard is expert-driven, since it requires an analyst’s opinion on certain key inputs, while the outputs are produced through a transparent, rule-based approach. The LGD engine is composed of six primary factors, each playing a different role in the estimate of loss. This includes:
- Pre- and post-default quantity and riskiness of cash flow/assets/economic value
- Seniority of exposure (e.g., senior bond or not)
- Jurisdiction
- Economic expectations
- Collateral and guarantees/insurance
- Recovery costs and workout policy (restructuring versus disposal)
Figure 2: LGD Scorecard Framework
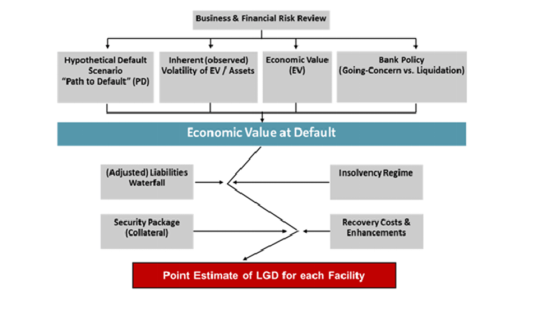
Source: S&P Global Market Intelligence. For illustrative purposes only.
The importance of the factors listed above has been validated by existing data and on-the-ground experience from observed resolutions afer default. The pre-default Expected Value at Default (EV) is stressed based on economic forecasts, the credit strength of the debtor, the current EV and the expected volatility of the EV. This stressed EV is adjusted for jurisdictional influences (e.g., operations in higher-risk countries) and recovery costs. Secured creditors are paid first with the pro-rata stressed EV related to their collateral, while the remaining stressed EV is paid according to the creditor waterfall (i.e., senior creditors get paid before junior creditors). At no point are averages used in the estimation process, leading to a robust estimate of loss for each individual exposure.
Using the LGD Scorecard, we projected the LGD for the 6,500+ transactions in the sample and obtained an average LGD of 46.02% when measured against year-end 2020 financials. The average LGD was almost the same as the 45% rule used by various financial institutions globally, as mentioned above. Figure 3 below shows the distribution of the LGD results across the six LGD buckets, which shows a normalized shape with buckets three and four having the highest frequency.
Figure 3: Expected LGD Using the Scorecard
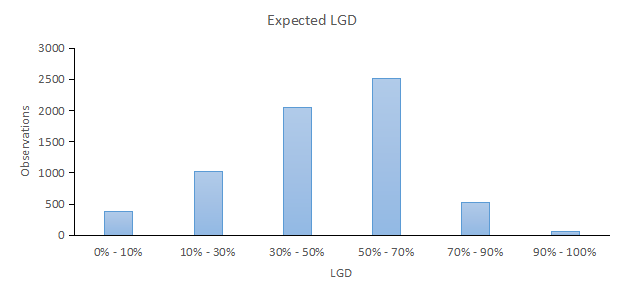
Source: S&P Global Market Intelligence Scorecards, as of March 31, 2022
Method 2: Statistical Approach
S&P Global Market Intelligence has also built an LGD statistical model, called LossStatsTM Model (LSM). LSM is designed to predict losses using a statistical technique and assumes a continuous conditional probability distribution that belongs to the exponential model family. LSM estimates the distribution of LGD of bonds and loans issued by corporations, considering industry- and instrument-specific characteristics and leveraging an extensive recovery database.
Through LSM, we projected the LGD for the 6,500+ transactions and obtained an average LGD of 44.48% when measured against year-end 2020 financials. The average LGD through LSM is, once again, almost the same as the the 45% rule. Figure 4 below shows that the significant majority of transactions fall in the third bucket, unlike the scorecard method that showed a normalized-like distribution. This is not a surprise as statistical models tend to offer less granularity and precision than expert-driven approaches, but offset this with more efficiency since they require less human intervention. The LSM statistical model required fewer inputs, as well. For example, the LSM model asks entities to be flagged as secured or unsecured without indicating the quantity of such seniority/subordination. The LGD Scorecard, on the other hand, looks at precisely how many liabilities are legally senior and junior to the exposure under consideration.
Figure 4: Expected LGD Using the LSM Statistical Model
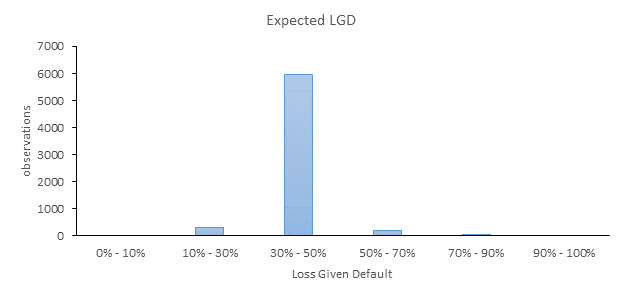
Source: S&P Global Market Intelligence Credit Analytics, as of March 31, 2022
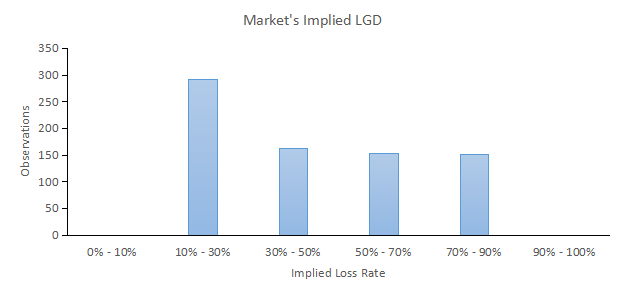
Method 3: Market-Implied LGD Approach
Finally, we applied a third innovative method to estimate losses of a financial transaction. We found the yield-to-worst (YTW) of 700+ bonds issued by entities from our representative universe. The YTW is a measure of return that investors expect to be compensated based on key characteristics of an issuance, most important being the credit risk. By stripping out the risk-free rate from the YTW of each transaction, we found the spread that is assumed to be a proxy for the credit risk premium (i.e., the premium that investors ask for to offset the risk of loss that they expect to incur from holding the investment). This credit risk premium is equivalent to an Expected Loss (EL), which is a combination of the Probability of Default (PD) and LGD. We calculated the PD for each issuer using the our PD Model Fundamentals (PDFN), a statistical model that combines business and financial risk to estimate the likelihood of an entity defaulting. By extracting the EL from the YTW of each transaction and calculating the PD of the issuer, we were able to find the market-implied LGD of each transaction.
The average LGD using the YTW method was 44%, again aligning well with the 45% rule and the averages found through the scorecard and statistical methods. Figure 5 below shows an even distribution across the various loss buckets, demonstrating that the market is indeed using different techniques to calculate LGD and not necessarily relying on the 45% rule.
Source: S&P Global Market Intelligence CapitalIQ & Credit Analytics, as of March 31, 2022
In Summary: Evaluate the Tradeoffs
We have offered a description of alternative methods to estimate LGD for financial transactions. While the average LGD is almost the same for the scorecard and statistical approaches, the distribution of the LSM LGD results tells a story that is significantly different. The LGD Scorecard is fundamentally driven and applies a credit-intuitive and rule-based approach with no training of the data required to design the model. It achieves a high level of differentiation when looking at the loss buckets. The statistical approach is quantitatively driven, which means it can be applied with little human intervention, but achieves less differentiation when looking at the loss buckets. The tradeoff between precision and efficiency is often seen when comparing statistical and expert-driven models. The choice of which approach to use comes down to the specific preferences of an institution. It is important to understand the differences, however.