
Stakeholders are turning to untraditional data sources to quantify the impact of the COVID-19 shutdown. While no single variable can forecast which locations will be most susceptible to the virus, mounting scientific literature suggests that there is a correlation between temperature and viral propagation. If correct, regions in the temperature ‘target zone’ may need to implement more stringent lockdown policies for a longer period to achieve comparable mitigation.
Investors can combine weather data with property data, to expose one dimension of risk for Real Estate Investment Trusts (REITs) of prolonged closures, as well as areas that may see a resurgence of the virus later this year. Figure 1 exemplifies this by showing the higher concentration of properties in locations favorable to COVID-19 propagation in the portfolio of Simon Property Group compared to Weingarten Realty Properties.
Figure 1. COVID-19 Optimal Survival Temperatures Overlaid with Property Holdings for Simon Property Group and Weingarten Realty Investors.
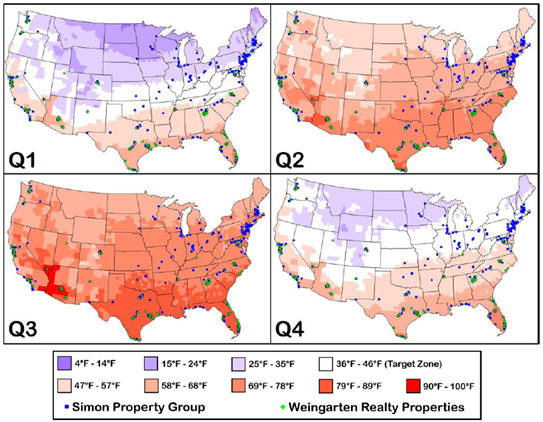
Note: The average hourly temperature was calculated at the Federal Information Processing Standard (FIPS) code level for each calendar quarter from 12:00am UTC January 1, 2016 – 12:00am UTC January 1, 2020.
Source: S&P Global Market Intelligence Quantamental Research. Data as of April 10, 2020.
Please access the complete list of Quantamental Research Briefs for the latest on COVID-19’s impact.
Explore S&P Global Marketplace
Click hereQuantamental Research Brief: Do Markets Yearn for the Dog Days of Summer? COVID, Climate, and Consternation
Click here
Quantamental Research Brief: Cold Turkey – Navigating Guidance Withdrawal with Supply Chain Data
Learn more