
Panjiva’s research team recently took part in a series of S&P Global Market Intelligence conferenced titled “Global Slowdown in 2019: A Healthy Necessity? Seizing Opportunities In Uncertain Times” with presentations to nearly 900 participants across both financial and non-financial customers in group sessions and one-on-one meetings across Tokyo, Hong Kong and Sydney.
From a supply chain perspective there was a focus on the causes and effects of the deteriorating trade relations between the U.S. and China. That’s arrived just as the world entered a technical trade recession (two consecutive three month periods of falling exports) in May.
The evidence for June is not good with 10 out of 12 countries that have reported data having shown a year over year decline in exports. Panjiva’s presentation focused on: the history and short-term outlook for the trade war; six corporate reactions – some of which are accelerating existing plans; and the knock on effect to regional economic development.
TRADE DOWNTURN STARTED JUST AS TRADE WAR GOT UNDERWAY
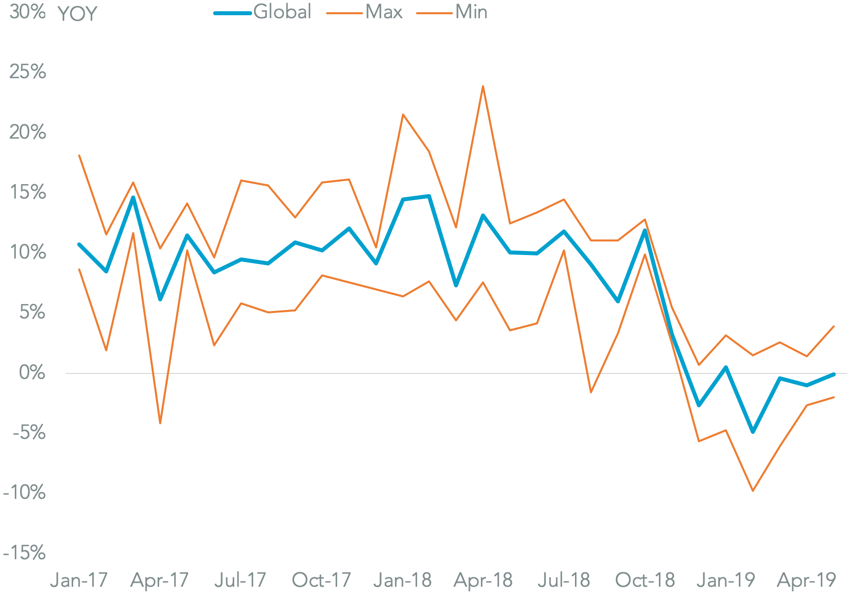
Chart shows year over year change in exports, in dollars, across 37 countries plus the European Union. Calculations based on S&P Global Market Intelligence figures. Source: Panjiva
From a top down perspective S&P Global Ratings’ Asia Chief Economist, Shaun Roache, noted that the conflict between the U.S. and China is about lot more than just tariffs. Indeed, one of the challenges facing the region is a slide in investment in the region.
As flagged in S&P Ratings research of July 9 the rate of real investment growth in the big five Asian trade-sensitive economies has dropped to a 2% contraction in 1Q 2019 from a 7.0% expansion in 1Q 2017. That may reflect a higher degree of business uncertainty, and will certainly have a longer-term effect on economic development than the fleeting impact of tariffs.
ASIA-PACIFIC REAL INVESTMENT GROWTH HAS SLOWED SINCE LATE 2018
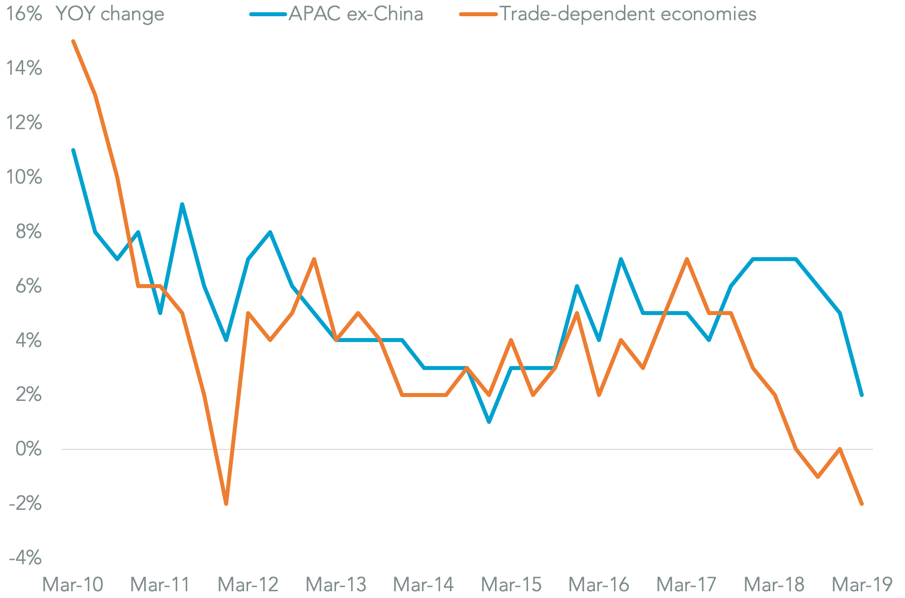
Chart year over year change in investments in real terms. Trade dependent economies include Malaysia, Singapore, South Korea, Taiwan, and Thailand. Calculations based on data from S&P Global Ratings. Source: Panjiva
Roache also noted that the dispute between the U.S. and China can be most effectively viewed through the lens of technology supply chains. The Trump administration has concerns as they relate to China achieving its economic development by not following globally agreed rules on: protection of intellectual property; provision of access to markets (especially in high growth new economy sectors); and a level playing field with regards to industrial policy.
Technology has been vital for China’s economic development so far, with total factor productivity being the largest contributor to Chinese GDP growth. In the 2010s TFP has accounted for 4.1% points of the 7.3% average growth in GDP. In the 2020s it is estimated to represent 2.2% points out of 4.2% growth.
ACCOUNTING FOR CHINA’S GROWTH SINCE 1960
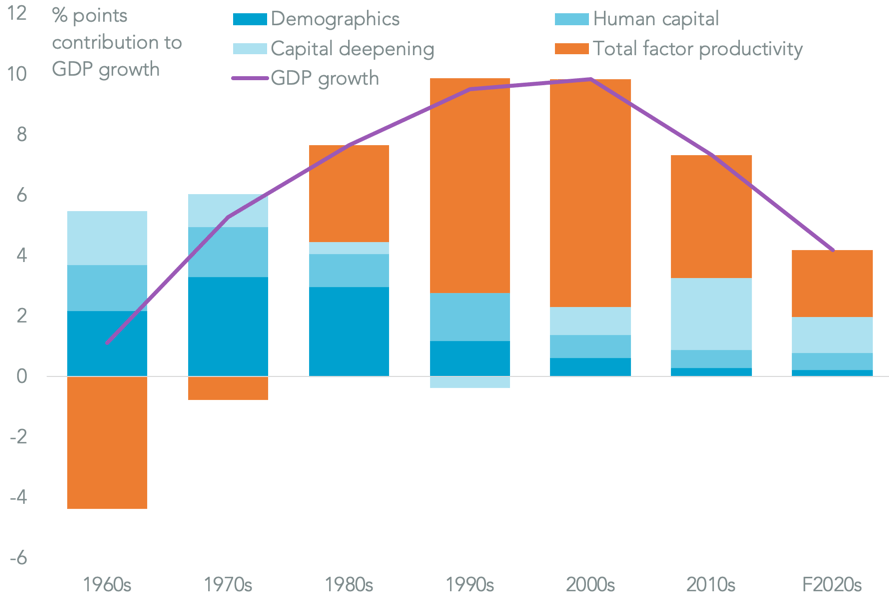
Chart segments average change in Chinese GDP by factor contribution. F = forecast. Calculations based on Penn World Tables, China’s National Bureau of Statistics, U.N. population projections, and S&P Global Economics data. Source: Panjiva
Limiting China’s access to high technology may therefore be the most effective way to bring about policy change. The U.S. has already put instruments in place to achieve that via export restrictions – e.g. Huawei – and by cutting investment access to U.S. assets.
Those may prove to be effective given how exposed Chinese companies are to overseas supply chains.
An analysis based on S&P Global Market Intelligence’s business relationships database – which relies on company filings and maps according to nation of corporate ownership rather than physical trade flows – shows that 57.5% of business relations for quoted companies that are defined as buyers of intermediate technology products are with non-Chinese firms.
Similar results persist across the supply chain. Taking the 42.5% of “domestic” suppliers, 47.2% of their suppliers (i.e. level 1 suppliers) are from overseas, while in the next level of suppliers foreign firms represented 51.4% of the total.
It’s worth noting that suppliers from the U.S. only accounted for 18.2% of purchasing relationships, 9.3% of tier one and 6.7% of tier two – i.e. U.S. actions would be significantly more effective if built into multinational actions.
HEADQUARTERS LOCATION OF FIRMS IN CHINA’S SUPPLY CHAIN
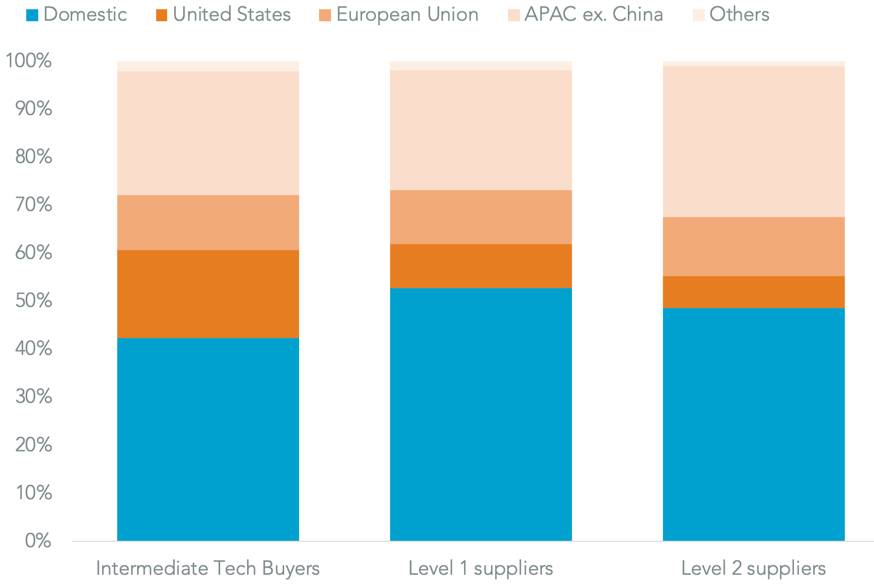
Chart segments business relationships identified for Chinese companies involved in purchasing intermediate technology products by headquarters location of supplier. Calculations based S&P Global Market Intelligence and S&P Global Economics. Source: Panjiva
Many of the questions asked by audiences at the events dwelt on domestic issues, though three major areas were repeated:
Q: Who else may benefit from the trade war besides Vietnam (featured in the research)
A: So far no-one has demonstrably “won” – in large part because corporate reactions in the short-term have been focused on price increases and stockpiling rather than fundamental supply chain retooling, as outlined in Panjiva’s research of Jun. 14. Notably an analysis of year over year export growth shows that as of the three months to May 31 only India, Australia, New Zealand and Vietnam have seen an expansion in exports. Indeed, up untl the month of June, China had seen expanding exports.
Q: Does China have any “nuclear” options?
A: Commercially the trade imbalance makes it difficult for China to “win” by restricting physical goods trade with the U.S. It could however, pursue non-tariff routes to restricting U.S. services businesses’ operations in the U.S. The potential “unreliable entities” list may be on option. Physical or cyber interdiction of international trade would be counterproductive.
From a commercial perspective China may be better served building an alternative free-trade coalition to prevent the U.S. from applying multilateral pressure. That may take the form of delivering the RCEP free trade deal though, as outlined in Panjiva’s 3Q 2019 Outlook there’s lots of reasons that may not work in the near-term.
Q: What’s needed to end the trade war / will a change in U.S. Presidency mark a change?
A: Simply put – a huge and unlikely compromise. As discussed above the U.S. is unlikely to accept anything other than significant, verifiable policy change from China in regards to IP, access to markets and support for state-owned enterprises towards U.S. “norms”.
For China’s part the government wants to be left to freely direct policy to meet economic development aims, including the complete removal of all existing tariffs. The two look mutually incompatible, if only for national pride reasons ahead of the 70th anniversary of the People’s Republic of China and the U.S. elections in Nov. 2020.
A change in President in the U.S. may change the tactics, but not the strategy. Several Democratic Party candidates have stated they are keen to “rein in “ China and there has been a bipartisan bill introduced recently to codify limits on exports to China including Huawei.
As stated in both Panjiva and S&P Ratings research – the trade war between the U.S. and China is not new, and It’s not going away.
WINNING DURING A TRADE WAR NOT THE SAME AS WINNING THE TRADE WAR
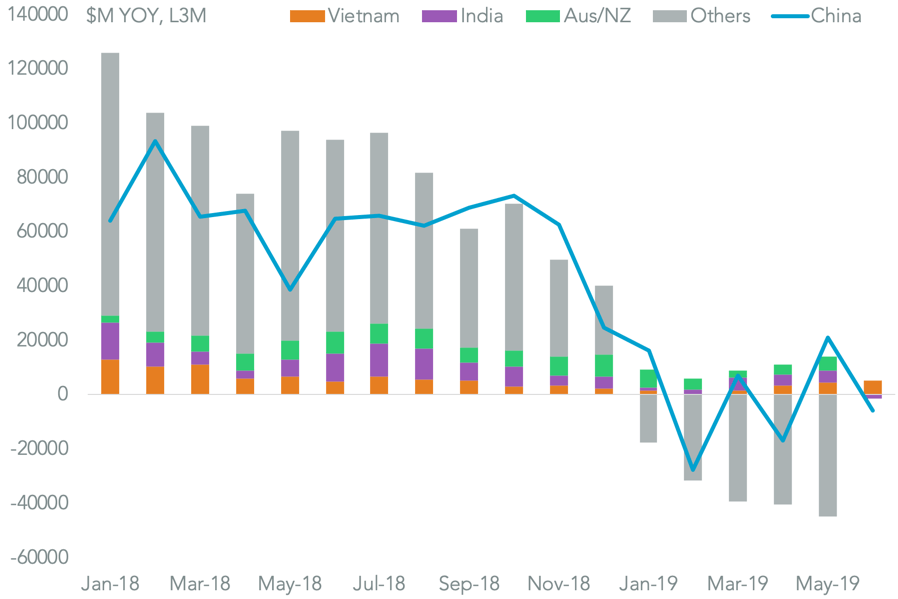
Chart segments year over year change in global exports on a trailing three months basis by origin. Calculations based on S&P Global Market Intelligence data. Source: Panjiva