
- Do longer reports, sent out frequently, necessarily translate to more useful information?
The saying "empty vessels make the most noise" holds true in the realm of language analysis, where each word functions as a token representing a data point. Effective text analysis, akin to signal processing, requires isolating the meaningful signal (i.e., words indicating credit trends) from the irrelevant noise (e.g., filler words or over-sensationalized opinions that fade post-hype). Noise may occur more frequently but provide no insight into credit trends. Hype attracts viewership may still indicate trends but tend to overreact. Ideally, one seeks to have less frequent, but still timely, words providing precise indicators of credit trends.
S&P Global Ratings research is a potential candidate for uncovering such trends as it culminates in issuer credit ratings, which have a proven ability to distinguish between defaulters and non-defaulters over a one-year period with very high discriminatory power.
- A look into credit rating reports
Are there ways to tease out informative words within research? We examine Full Analysis, Summary Analysis, and Research Update reports to illustrate the varying levels of informativeness in research text. It is noteworthy that these reports are infrequent, making them informationally dense with minimal filler (noise) content. Rigorous editorial review is always applied to prevent over-sensationalism in language, hence the positive and negative text in the reports represent measured responses by the analysts to the entity’s credit conditions.
In addition, these reports follow a structured format, with sections such as:
- Company Description
- Highlights
- Overview/Ratings Action Overview
- Rationale
- Outlook
- Upside/Downside/Base Case Scenarios
- Business Risk
- Financial Risk
- Liquidity
- Environmental, Social, and Governance
- Covenant Analysis and Other Credit Ratings Drivers
- Key Statistics/Metrics
- The importance of word placement within sections of reports
The same words can carry very different meanings and levels of importance depending on where they are placed. As a simple illustration, the word “Good” carries much more meaning in the Credit Highlights section than if it was part of a company’s name (see Figure 1). Humans will naturally take this into account when reading reports, but machines need to be guided on where to look.
Figure 1: The Simply Good Foods Co. Full Analysis report published in Oct. 2023 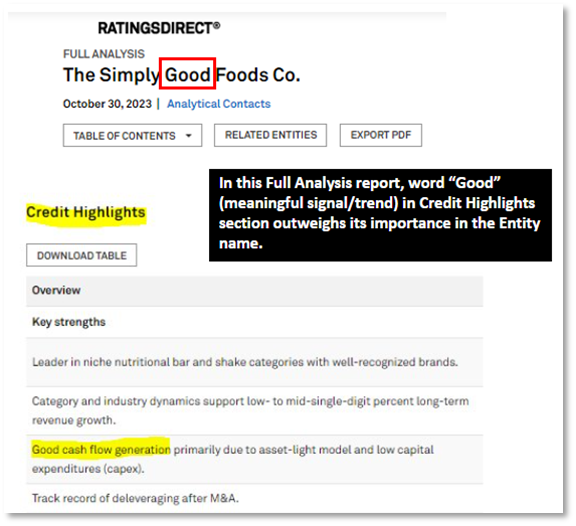
Source: RatingsDirect® on S&P Capital IQ Pro, from S&P Global Market Intelligence; Oct.2023. For illustrative purposes only.
- Informative content of sections in Full Analysis and Research Updates reports
We conducted two empirical experiments to assess:
1. The relative informativeness of different sections of an analyst's ratings view.
2. The predictive value of sections for ratings changes over a 12-month period.
4.1 The relative informativeness of sections
In the first experiment, we wanted to sanity test if the text sentiment in a section was consistent with the analyst’s view, i.e., the credit rating and if it:
- Varies by credit rating.
- Varies by credit rating after controlling for (i.e., accounting for) CreditWatch and Outlook.
This first experiment tests if AFINN sentiment score[1] (i.e., an open-source lexicon that measures sentiment with a numeric score between -5 and 5) is sensible and if there is potential information about the analyst’s view on an entity’s credit risk that is not already captured in CreditWatch and Outlook of the credit rating.
Figure 2 represents sentiment scores, highlighting a correlation between higher or positive scores and positive sentiment in investment-grade ratings. Conversely, speculative-grade ratings exhibit lower or more negative scores, indicating a less positive sentiment.[2]
Figure 2: Mean AFINN sentiment scores for each credit rating category 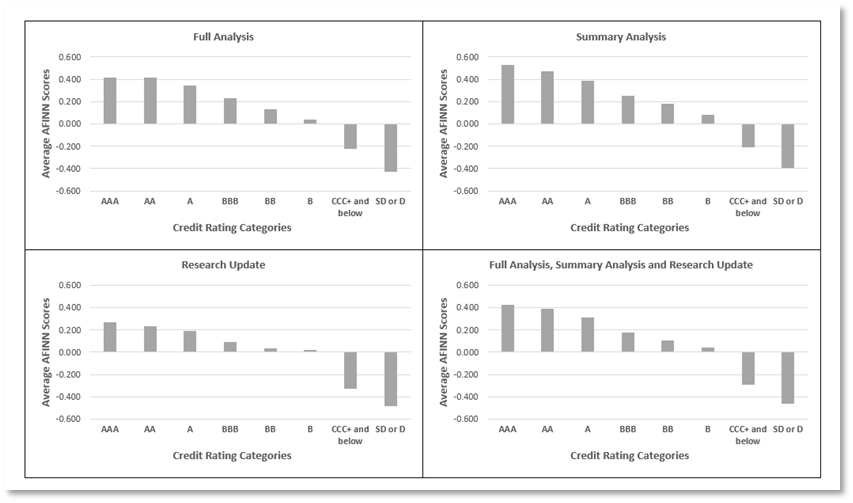
Source: Credit ratings from RatingsXpress® Credit Ratings. Digitized research from RatingsXpress®: Research, both from S&P Global Market Intelligence. AFINN Sentiment Scores are sourced from http://www2.imm.dtu.dk/pubdb/pubs/6010-full.html As of Dec. 2023. For illustrative purposes only.
4.2 The predictive value of sections in S&P Global Ratings entity level research reports
The second experiment gives us an idea if research sentiment has incremental predictive power (i.e., the ability to predict future ratings changes over a one-year period, even in cases where there is a CreditWatch and Outlook). [3]
More ratings upgrades occurred when AFINN Sentiment Scores were positive (henceforth defined as at least one standard deviation above mean for its original rating level) versus negative (henceforth defined as at least one standard deviation below mean for its original rating level) for positive ratings Outlooks, and more ratings downgrades took place when AFINN Sentiment Scores were negative versus positive for negative Outlook. Results were mixed when ratings outlook was Stable. This indicates that research sentiment could strength the signal indicated by positive/negative ratings outlooks.
Similarly, there were more ratings upgrades when AFINN Sentiment Scores were positive when CreditWatch was positive, and more ratings downgrades when AFINN Sentiment Scores were negative when CreditWatch was negative.
The potential for AFINN scores to enhance the predictability of CreditWatch and outlook
Table 1: Comparison between upgrades and downgrades within Outlook, CreditWatch and AFINN Sentiment Score buckets
|
Ratings Outlook |
AFINN Sentiment Score |
Sample Size |
% Upgrades |
% Downgrades |
|
Positive |
Positive: Higher than 1 SD above median, by ratings level |
1,294 |
20.0 |
11.4 |
|
Negative: Lower than 1 SD below median, by ratings level |
779 |
6.7 |
4.0 |
|
|
Stable |
Positive: Higher than 1 SD above median, by ratings level |
5,343 |
57.2 |
60.2 |
|
Negative: Lower than 1 SD below median, by ratings level |
5,041 |
46.1 |
42.1 |
|
|
Negative |
Positive: Higher than 1 SD above median, by ratings level |
1,710 |
22.8 |
28.4 |
|
Negative: Lower than 1 SD below median, by ratings level |
4,388 |
47.2 |
53.8 |
|
CreditWatch |
AFINN Sentiment Score |
Sample Size |
% Upgrades |
% Downgrades |
|
Watch Pos |
Positive: Higher than 1 SD above median, by ratings level |
404 |
8.1 |
4.1 |
|
Negative: Lower than 1 SD below median, by ratings level |
193 |
2.5 |
0.8 |
|
|
Watch Neg |
Positive: Higher than 1 SD above median, by ratings level |
398 |
4.5 |
7.3 |
|
Negative: Lower than 1 SD below median, by ratings level |
1,164 |
2.5 |
13.4 |
Source: Credit ratings from RatingsXpress®: Credit Ratings. Digitized research from RatingsXpress®: Research, both from S&P Global Market Intelligence. AFINN Sentiment Scores are sourced from http://www2.imm.dtu.dk/pubdb/pubs/6010-full.html As of Dec. 2023. For illustrative purposes only.
In the regression analysis in the Appendix B and C we note that the sections where we expected to have information content, such as Ratings Rationale, Overview/Ratings Overview, Ratings Outlook, and Highlights had an extremely high predictive power on credit ratings changes (i.e., better than 1% statistical significance) than generic sections such as Key Statistics and Company Description, which were included to test the model as a controlled experiment.
The downside scenario section has more information content than the upside scenario section. While there is some variation in the tone of both sections, analysts tend to be more expressive in their concerns on credit ratings downgrades, while maintaining a closer to neutral tone on credit ratings upgrades.
- Case studies
Case Study 1: Informativeness of text from Research Update reports
3M Downgraded To 'A+' On Continued End-Market Pressure, High Leverage; Outlook Negative in February 2020. Despite holding a higher credit rating with a stable outlook in January 2020, the sentiment score from research had been consistently negative since 2019, as illustrated in Figure 3.
Figure 3: 3M Co.’s (NYSE:MMM) Research Updates reports between the years 2019 and 2020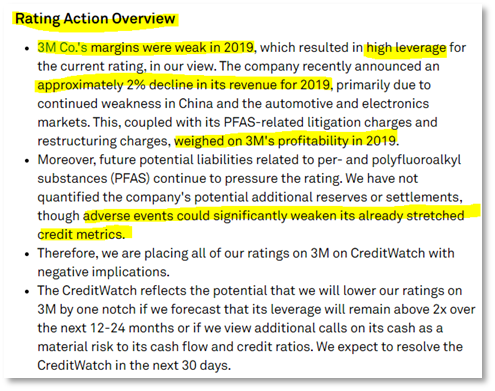
Source: Research Update report - 3M Co. Ratings Placed On CreditWatch Negative On End-Market Weakness And High Debt Leverage (Jan. 2020), RatingsDirect® on S&P Capital IQ Pro, from S&P Global Market Intelligence. For illustrative purposes only.
Case Study 2: Informativeness of text from Full Analysis reports
Dillard's Inc. Ratings Lowered To 'BB-' On Uncertainty Surrounding Coronavirus Impact; Outlook Negative in April 2020. Prior to this, the company held a superior credit rating with a stable outlook. However, the Full Analysis report from December 2019 indicated a relatively low sentiment score of -0.3, which was one standard deviation below the average for ratings reports published for similarly rated entities. Excerpts from sections such as Credit Highlights and Business Risk are provided in Figure 4.
Figure 4: Dillard’s, Inc. (NYSE:DDS) Full Analysis report from the year 2019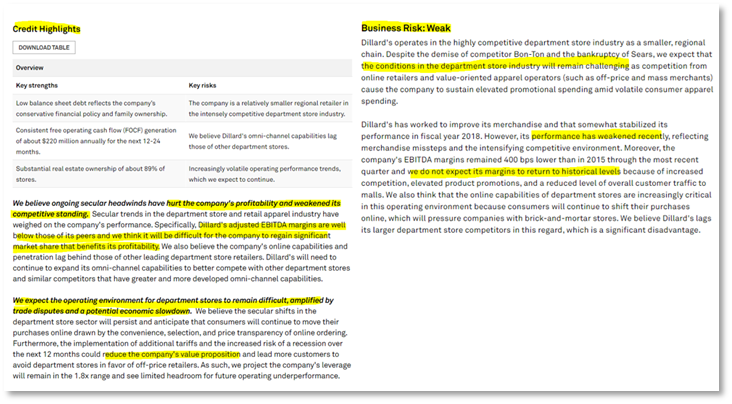
Source: Dillard’s Inc. Full Analysis Report (Dec. 2019), RatingsDirect® on S&P Capital IQ Pro, from S&P Global Market Intelligence. For illustrative purposes only.
Share prices of Dillard's, Inc. (NYSE:DDS) started declining in late March 2020, just before the official rating downgrade. Interestingly, ratings analysts had indicated a potential downgrade a year earlier through the sentiment scores from the Full Analysis reports published between years 2018 and 2019.
Figure 5: Share prices of Dillard's, Inc. (NYSE:DDS) 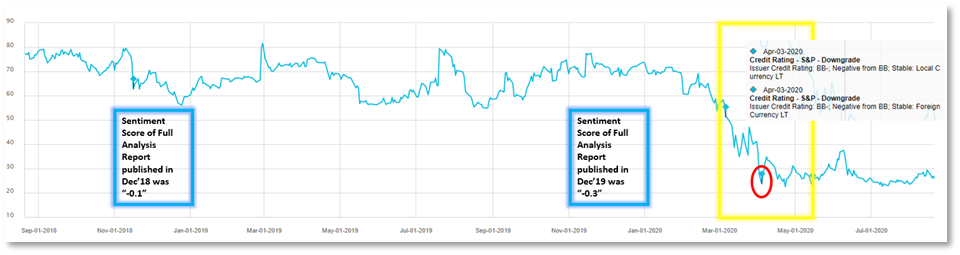
Source: RatingsDirect® on S&P Capital IQ Pro, from S&P Global Market Intelligence. As of Jan. 2024. For illustrative purposes only.
- Conclusions and Forthcoming Thought Leadership
In conclusion, our analysis shows the potential for specific sections in Full Analysis and Research Update reports to be used as a component for early warning systems in credit ratings changes. Within these reports, even when the Outlook and CreditWatch levels remain constant, analysts convey more nuanced and forward-looking perspectives on potential rating changes. This heightened expressiveness is notably observed in the Executive Summary sections that encompass highlights, plus an overview, rationale, and outlook. Additionally, areas where analysts flag downside risks for an entity, such as comments on the downside scenario, business risk, financial risk, and liquidity, serve as critical indicators for vigilant monitoring and proactive decision-making. This nuanced approach offers end users a more comprehensive understanding of potential credit rating shifts, contributing to the development of effective early warning models.
In the next installments of this blog we investigate:
- Can we find alpha from text in ratings research report?
- Industry-level early warning signals from commentaries reports
- A holistic view of credit early warning, incorporating multiple inputs
APPENDIX A: Research Methodology and Summary Statistics
We utilize the R programming language for AFINN Sentiment Score calculations, data cleaning, and statistical analysis on research reports. The AFINN lexicon is an open-source resource that assigns sentiment scores to words on a scale from +5 to -5 to gauge the sentiment or mood conveyed in the text of our research reports. By aggregating these scores, we derive an overarching sentiment score for the reports under study. We anticipate consistent results when employing alternative sentiment proxies. In the data cleaning process, we replace NULL or NA values in the Outlook and CreditWatch columns with zeros. This categorization indicates neither a positive nor negative Outlook or CreditWatch status. We perform both ANOVA analysis and linear regression with Newey West estimators to adjust for heteroskedasticity and autocorrelation in error terms.
Table 2: Summary statistics by report type
|
|
|
|
AFINN Sentiment Scores |
||||
|
Report Type |
Rating Category |
Sample Size (N) |
Minimum |
Mean |
SD |
Median |
Maximum |
|
Full Analysis |
AAA |
2,137 |
-0.879 |
0.417 |
0.339 |
0.422 |
1.594 |
|
AA |
8,623 |
-1.053 |
0.418 |
0.353 |
0.400 |
2.000 |
|
|
A |
21,782 |
-2.333 |
0.345 |
0.365 |
0.339 |
2.000 |
|
|
BBB |
23,373 |
-2.000 |
0.231 |
0.352 |
0.226 |
3.000 |
|
|
BB |
12,445 |
-2.000 |
0.129 |
0.347 |
0.116 |
1.563 |
|
|
B |
13,883 |
-2.000 |
0.039 |
0.352 |
0.042 |
3.000 |
|
|
CCC+ and below |
1,543 |
-1.500 |
-0.223 |
0.424 |
-0.235 |
1.378 |
|
|
SD or D |
124 |
-1.667 |
-0.432 |
0.453 |
-0.378 |
0.421 |
|
|
Summary Analysis |
AAA |
2,662 |
-0.900 |
0.528 |
0.490 |
0.516 |
2.750 |
|
AA |
10,454 |
-2.000 |
0.472 |
0.462 |
0.457 |
2.214 |
|
|
A |
27,710 |
-2.000 |
0.386 |
0.447 |
0.380 |
2.000 |
|
|
BBB |
32,335 |
-2.000 |
0.250 |
0.429 |
0.242 |
2.125 |
|
|
BB |
20,310 |
-2.000 |
0.181 |
0.428 |
0.174 |
2.000 |
|
|
B |
24,779 |
-2.000 |
0.080 |
0.421 |
0.074 |
2.000 |
|
|
CCC+ and below |
2,764 |
-2.077 |
-0.206 |
0.509 |
-0.225 |
1.813 |
|
|
SD or D |
565 |
-2.000 |
-0.390 |
0.831 |
-0.357 |
3.500 |
|
|
Research Update |
AAA |
1,453 |
-1.462 |
0.268 |
0.395 |
0.283 |
1.441 |
|
AA |
6,054 |
-2.000 |
0.231 |
0.437 |
0.238 |
1.625 |
|
|
A |
14,241 |
-2.000 |
0.194 |
0.476 |
0.209 |
1.898 |
|
|
BBB |
21,284 |
-1.933 |
0.089 |
0.462 |
0.101 |
2.100 |
|
|
BB |
18,420 |
-2.000 |
0.037 |
0.440 |
0.053 |
2.211 |
|
|
B |
29,779 |
-2.000 |
0.018 |
0.421 |
0.045 |
1.455 |
|
|
CCC+ and below |
6,129 |
-2.000 |
-0.325 |
0.461 |
-0.339 |
1.875 |
|
|
SD or D |
1,533 |
-2.000 |
-0.484 |
0.556 |
-0.474 |
1.286 |
|
|
Full Analysis, Summary Analysis, and Research Update |
AAA |
4,190 |
-1.462 |
0.428 |
0.447 |
0.414 |
2.750 |
|
AA |
17,213 |
-2.000 |
0.388 |
0.439 |
0.373 |
2.214 |
|
|
A |
45,786 |
-2.333 |
0.310 |
0.443 |
0.315 |
2.000 |
|
|
BBB |
58,101 |
-2.000 |
0.179 |
0.427 |
0.186 |
3.000 |
|
|
BB |
39,903 |
-2.000 |
0.103 |
0.424 |
0.104 |
2.211 |
|
|
B |
56,277 |
-2.000 |
0.041 |
0.409 |
0.054 |
3.000 |
|
|
CCC+ and below |
8,930 |
-2.077 |
-0.291 |
0.473 |
-0.303 |
1.875 |
|
|
SD or D |
2,083 |
-2.000 |
-0.463 |
0.635 |
-0.459 |
3.500 |
|
Source: Credit ratings from RatingsXpress®: Credit Ratings. Digitized research from RatingsXpress®: Research, both from S&P Global Market Intelligence. AFINN Sentiment Scores are sourced from http://www2.imm.dtu.dk/pubdb/pubs/6010-full.html As of Dec. 2023. For illustrative purposes only.
APPENDIX B: ANOVA Results
Cells denoted with an X below indicate statistical significance at 5% level, with most values having p-value < 0.001.
|
|
Dependent Variable |
AFINN Sentiment Score [Univariate] |
AFINN Sentiment Score [Multi-variate] |
AFINN Sentiment Score [Multi-variate] |
|
Section |
Sample size (N) |
Varies by current credit rating (ANOVA, F-statistic) |
Varies by current credit rating, after accounting for Outlook and CreditWatch (ANOVA, t-statistic) |
Positive related to current credit ratings, after accounting by Outlook, CreditWatch (t-statistic, OLS) |
|
Company description |
34,899 |
X |
X |
X |
|
Highlights |
17,052 |
X |
X |
X |
|
Overview/Ratings action overview |
68,685 |
X |
X |
X |
|
Rationale |
218,491 |
X |
X |
X |
|
Outlook |
208,903 |
X |
X |
X |
|
Base case scenario |
40,839 |
X |
X |
X |
|
Upside scenario |
70,371 |
X |
X |
X |
|
Downside scenario |
70,469 |
X |
X |
X |
|
Business Risk |
36,025 |
X |
X |
X |
|
Financial Risk |
36,577 |
X |
X |
X |
|
Liquidity |
49,970 |
X |
X |
X |
|
Environmental, social, and governance |
14,773 |
X |
X |
X |
|
Covenant analysis |
9,961 |
X |
X |
X |
|
Key statistics |
7,837 |
|
|
|
Source: Credit ratings from RatingsXpress®: Credit Ratings. Digitized research from RatingsXpress®: Research, both from S&P Global Market Intelligence. AFINN Sentiment Scores are sourced from http://www2.imm.dtu.dk/pubdb/pubs/6010-full.html. As of Dec. 2023. For illustrative purposes only.
APPENDIX C: Linear Regression Results
Cells denoted with an X below indicate statistical significance at 5% level, with most values having p-value < 0.001.
|
|
Dependent Variable |
Ratings changes over 12-month period [Univariate]
|
Ratings changes over 12-month period [Multivariate] |
|
Section |
Sample size (N) |
Predicts ratings changes over 12-month period (t-statistic, Newey-West estimator) |
Predicts ratings changes over 12-month period, controlling for creditwatch and outlook (t-statistic, Newey-West estimator) |
|
Company description |
34,899 |
|
|
|
Highlights |
17,052 |
X |
X |
|
Overview/Ratings action overview |
68,685 |
X |
X |
|
Rationale |
218,491 |
X |
X |
|
Outlook |
208,903 |
X |
X |
|
Base case scenario |
40,839 |
|
|
|
Upside scenario |
70,371 |
|
|
|
Downside scenario |
70,469 |
X |
X |
|
Business risk |
36,025 |
X |
X |
|
Financial risk |
36,577 |
X |
X |
|
Liquidity |
49,970 |
X |
X |
|
Environmental, social, and governance |
14,773 |
|
|
|
Covenant analysis |
9,961 |
|
|
|
Key statistics |
7,837 |
|
|
Source: Credit ratings from RatingsXpress®: Credit Ratings. Digitized research from RatingsXpress®: Research, both from S&P Global Market Intelligence. AFINN Sentiment Scores are sourced from http://www2.imm.dtu.dk/pubdb/pubs/6010-full.html As of Dec. 2023. For illustrative purposes only.
[1] Source: http://www2.imm.dtu.dk/pubdb/pubs/6010-full.html. End users can use other sentiment lexicons of their choice and we expect similar results to hold given the high statistical significance of the results reported. See Appendix A for a detailed sample description, methodologies used for data cleaning and sentiment scored calculations, and statistical summary.