Progress toward a phase one trade deal between the U.S. and China may be struggling. The PRC Ministry of Commerce has stated with regards to U.S.-China trade talks that “China believes that if the two parties reach a first-phase agreement, tariffs should be reduced accordingly. The economic and trade teams of the two sides have been maintaining close communication.“
It’s difficult to see how the U.S. can accede to a rollback in tariffs without firm commitments on commodity purchases and policy behavior change, running the risk of a repeat in the cycle of tariff escalation and talks that has been seen since Aug. 2017.
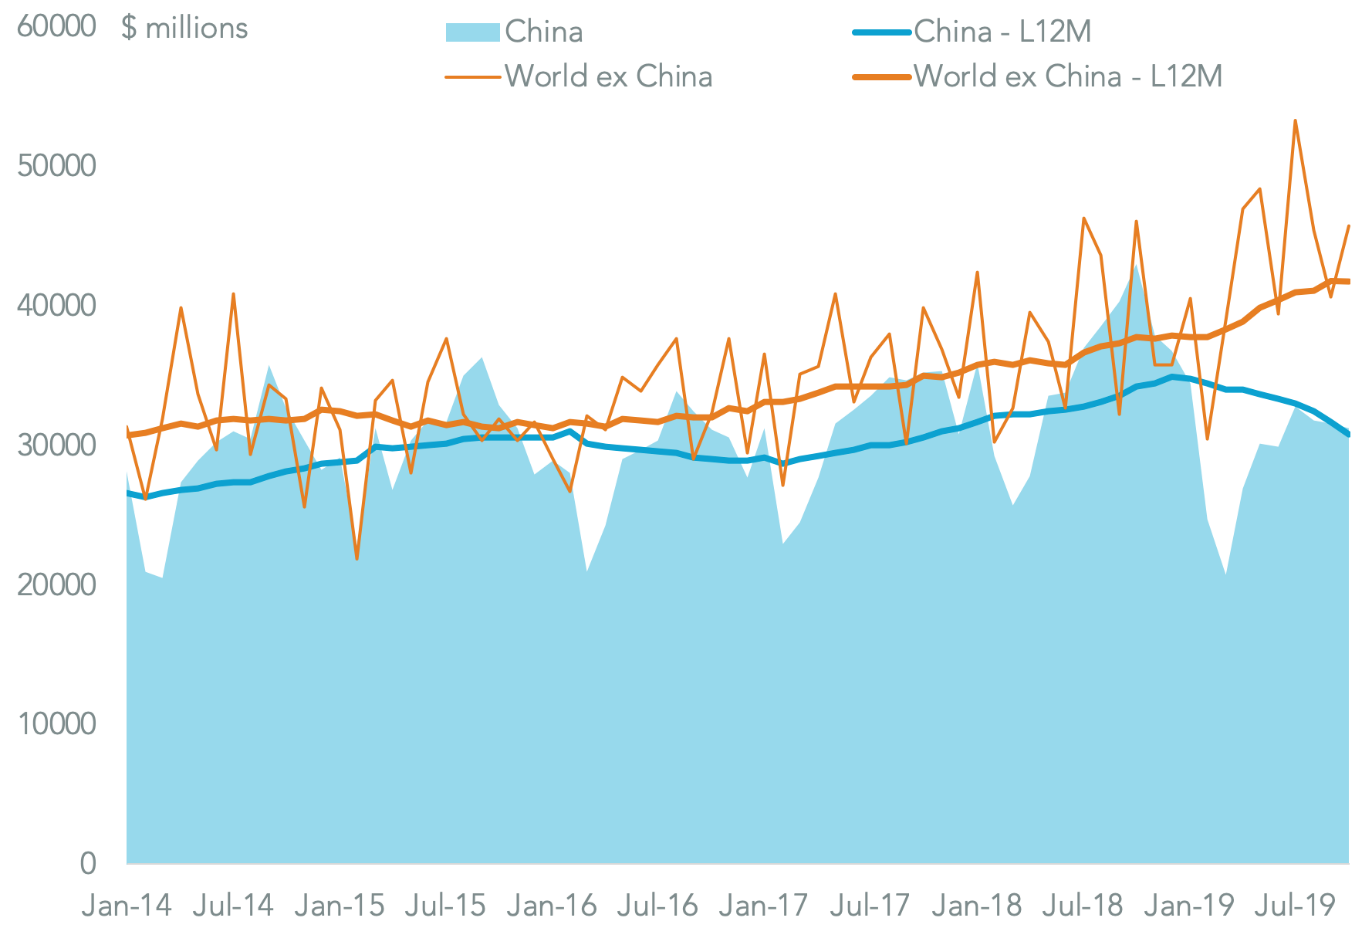
Indeed, there’s little reason for the Trump administration to back away from tariffs as a method for delivering its policy aims. As outlined in Panjiva research of December 6, U.S. imports from China continued to crater in October with a 23.1% year over year decline.
By contrast, exports only declined by 2.8%. As a result the trade-in-goods deficit – a key administration benchmark where a reduction represents policy success – fell 27.4% to $31.3 billion for the month. On an annual basis that represents a total of $369.2 billion in the past 12 months. That was the lowest since Sept. 2017, though it’s still 6.4% above the level of Dec. 2016.
DEFICIT WITH CHINA CONTINUES TO DECLINE

Chart segments U.S. trade-in-goods balance with China. Calculations based on U.S. Census Bureau data. Source: Panjiva
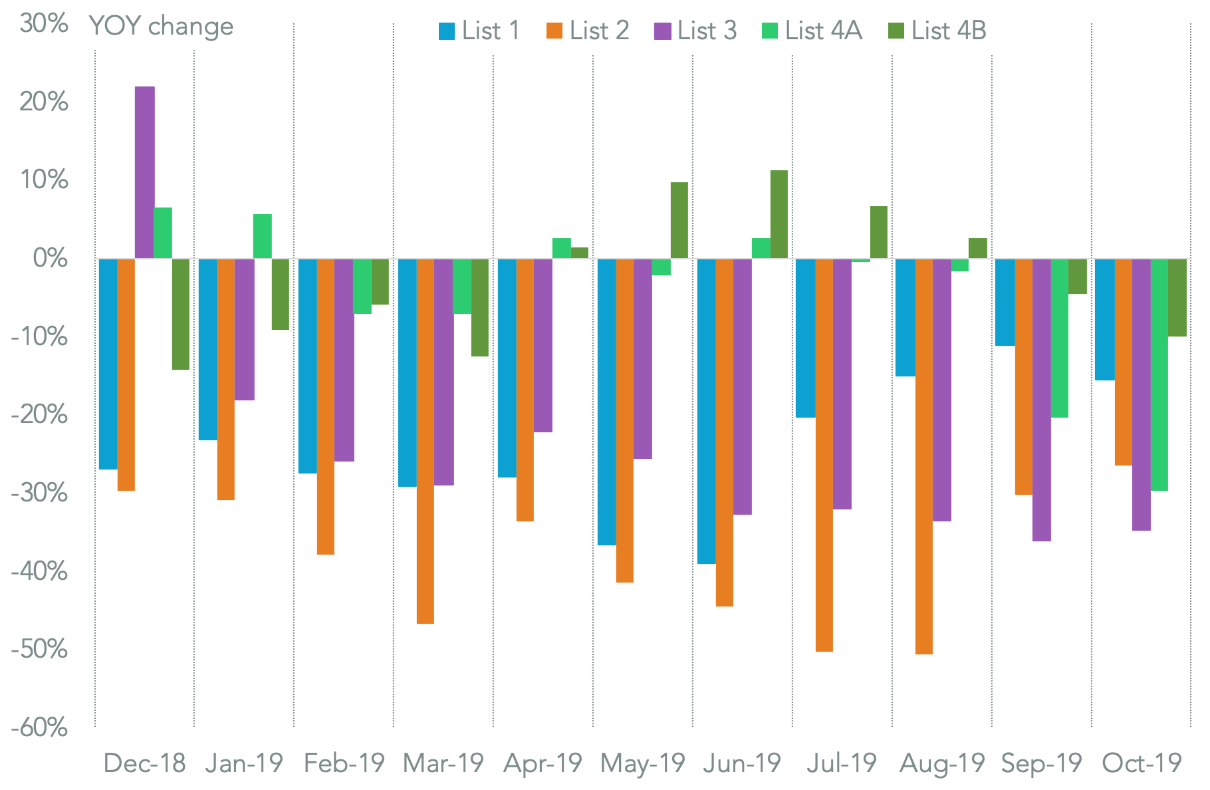
At a more granular level, Panjiva’s analysis shows that the drop in imports is a clear sign of tariffs continuing to bite, even though we’re now 15 months after the launch of list 1 tariffs from July 2018. Imports of list 1 products dropped by 15.0% year over year in October. That was the slowest rate of decline since the tariffs were introduced but are nonetheless still sliding.
For list 2 products where tariffs were introduced in August 2018 the decline was a more substantial 50.6%, suggesting manufacturers are still in the process of realigning their supply chains.
List 3 products, which include some consumer goods such as furniture as well as a wide range of capital equipment fell by 34.8% after their initial introduction at a 10% duty rate in September 2018, which rose to 25% in May 2019.
The most recent round, list 4A covering mostly basic consumer goods at a 15% rate in September 2019, dropped by 29.7%. That would suggest the lower duty rates have – so far – proven effective, but less effective, than the 25% rate. That may provide an incentive for the administration to raise rates to apply extra pressure.
Finally, list 4B products – where 15% tariffs are due to be applied from December 15 if a phase 1 trade deal isn’t reached – fell by 10.0%. That would suggest little sign of stockpiling of the product group which is concentrated on phones, laptops and winter apparel. It may indicate a lack of concern among importers about the failure of phase 1 talks.
The latter is perhaps understandable given negotiations were in a more positive place in September, when buying decisions were being made, as outlined in Panjiva’s research of November 12. Furthermore, fundamental demand for consumer goods may be weaker – imports excluding China fell by 9.5% year over year.
TARIFF MAN CRUSHES IMPORTS FROM CHINA

Chart segments U.S. imports from China by section 301 tariff list. Source: Panjiva
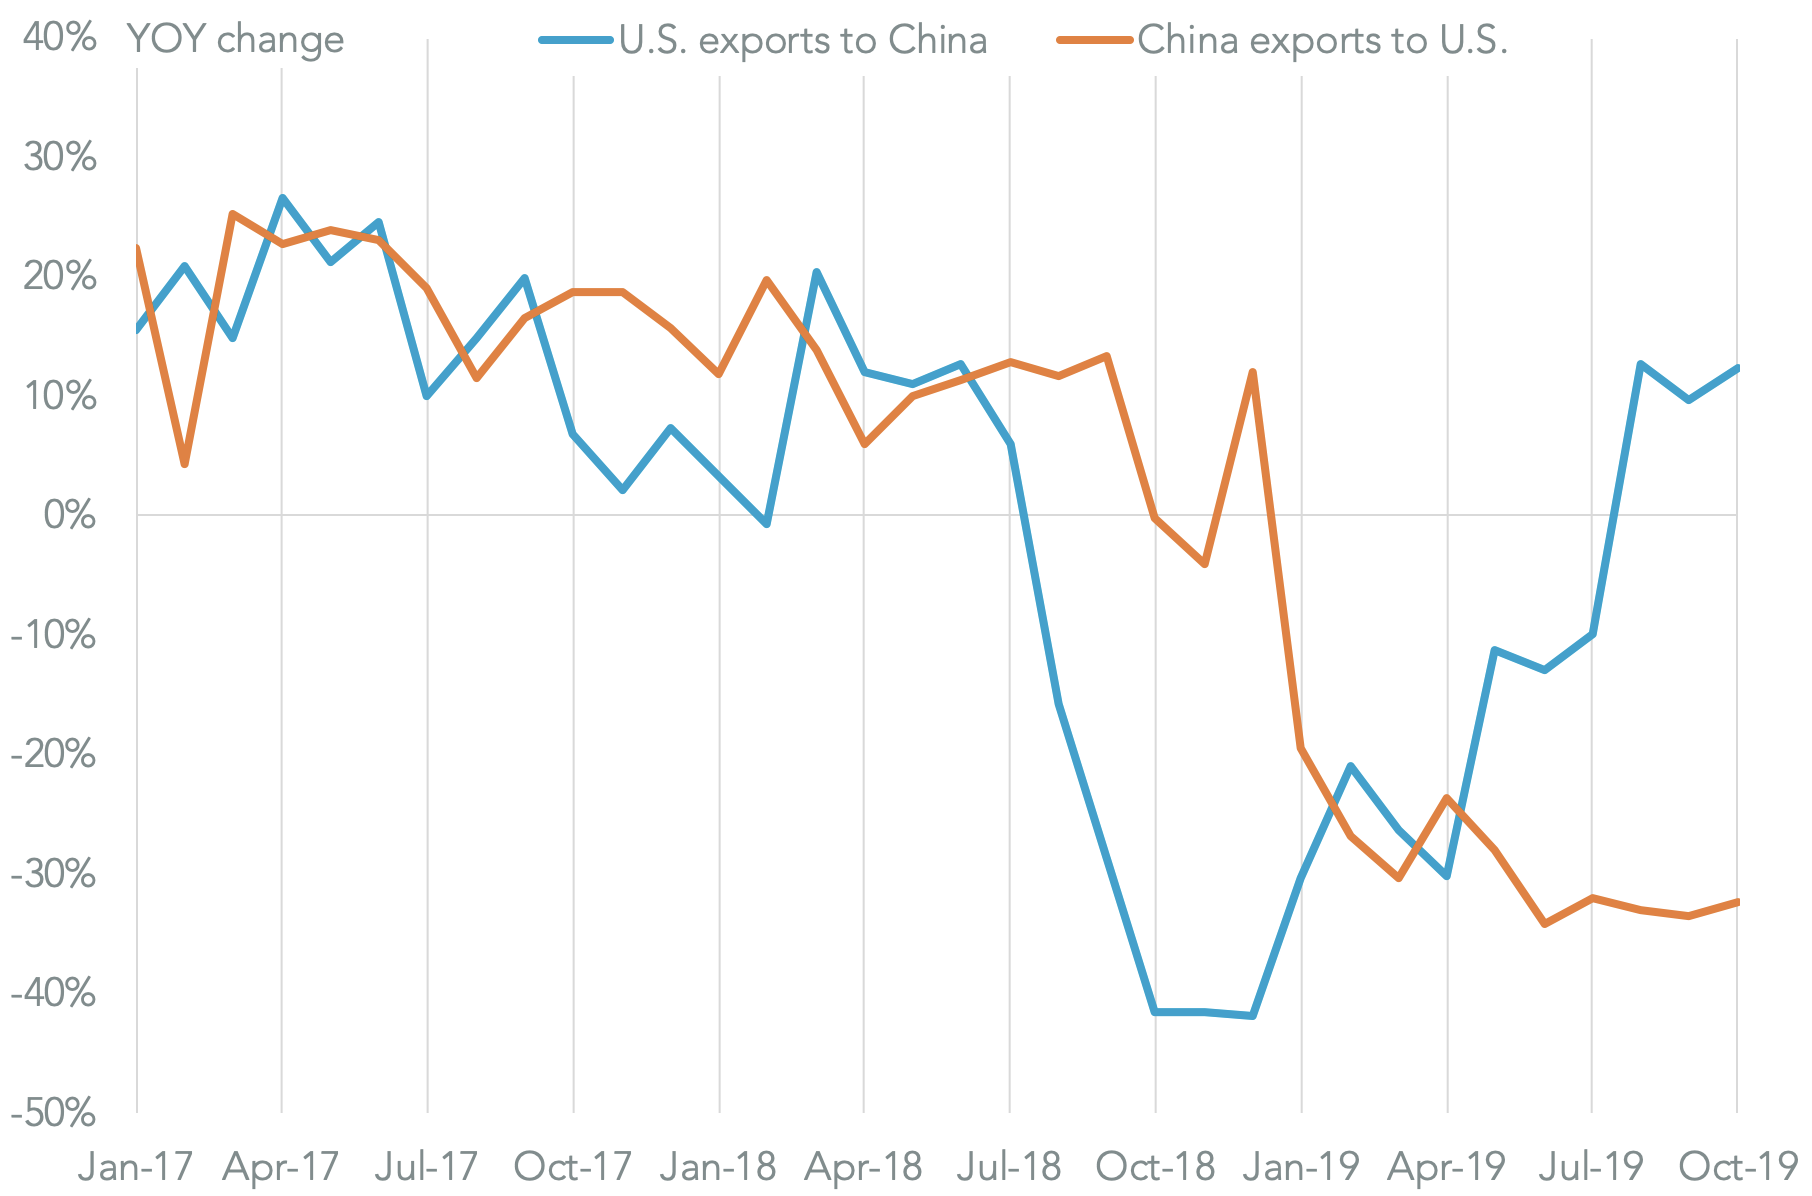
The impact of China’s tariff policy appears to be proving less effective. U.S. exports of products where retaliatory duties on list 1 to 3 tariffs fell 12.4% in October. By contrast imports of list 1-3 of U.S. imports fell by 32.3% – i.e. 2.6x as effective.
CHINA’S RETALIATION PROVES LESS EFFECTIVE THAN AMERICA’S OFFENSE

Chart segments change in U.S. trade in goods where tariffs were applied in 3Q 2019 by direction. Source: Panjiva
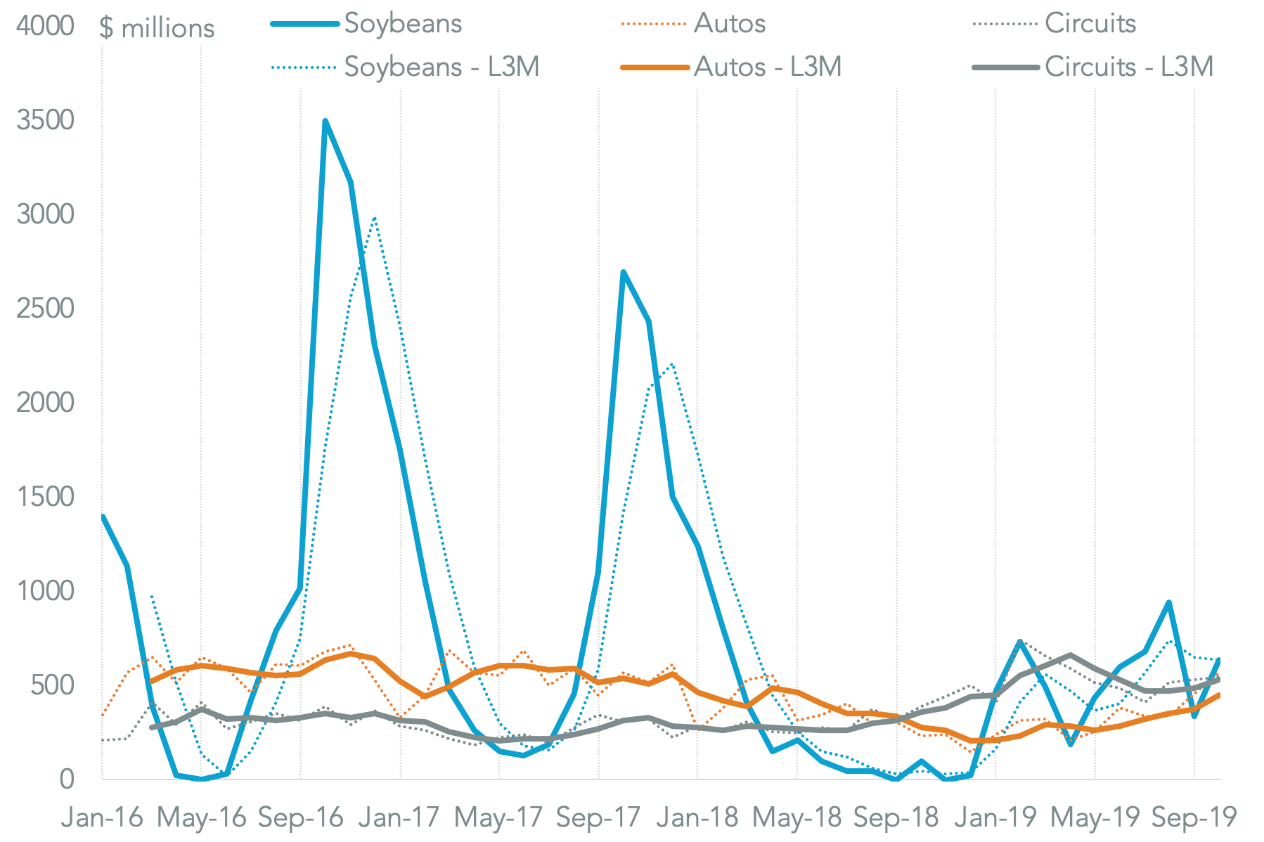
The slower decline in exports by the U.S. to China was largely down to just three product groups. Exports of soybeans surged 5.5x year over year to $634 million, Panjiva data shows. That was in line with the monthly average of $654 million seen in 3Q and may reflect ongoing “goodwill” purchases by China of a key farm-state export for the U.S.
Imports of mid-sized autos (HS-8703.23) jumped by 145%, including seaborne shipments by BMW and Daimler among others. That compared to an 11.3% rise in the prior three months and was largely down to the timing of tariff relief in prior months and was largely in line with levels seen in 2017.
In the electronics sector meanwhile there was a 41.6% surge in exports of electronic circuits. The prospect of tighter restraints on exports of technology products by the Commerce department – which could lead to a CFIUS-type arrangement – may be worrying Chinese importers. It should be noted that the products are not yet covered by Chinese retaliatory duties.
BEAN BOUNCE BOLSTERS EXPORTS

Chart compares U.S. exports of soybeans, mid-size autos and electronic circuits to China on a monthly and three-month average basis. Source: Panjiva


