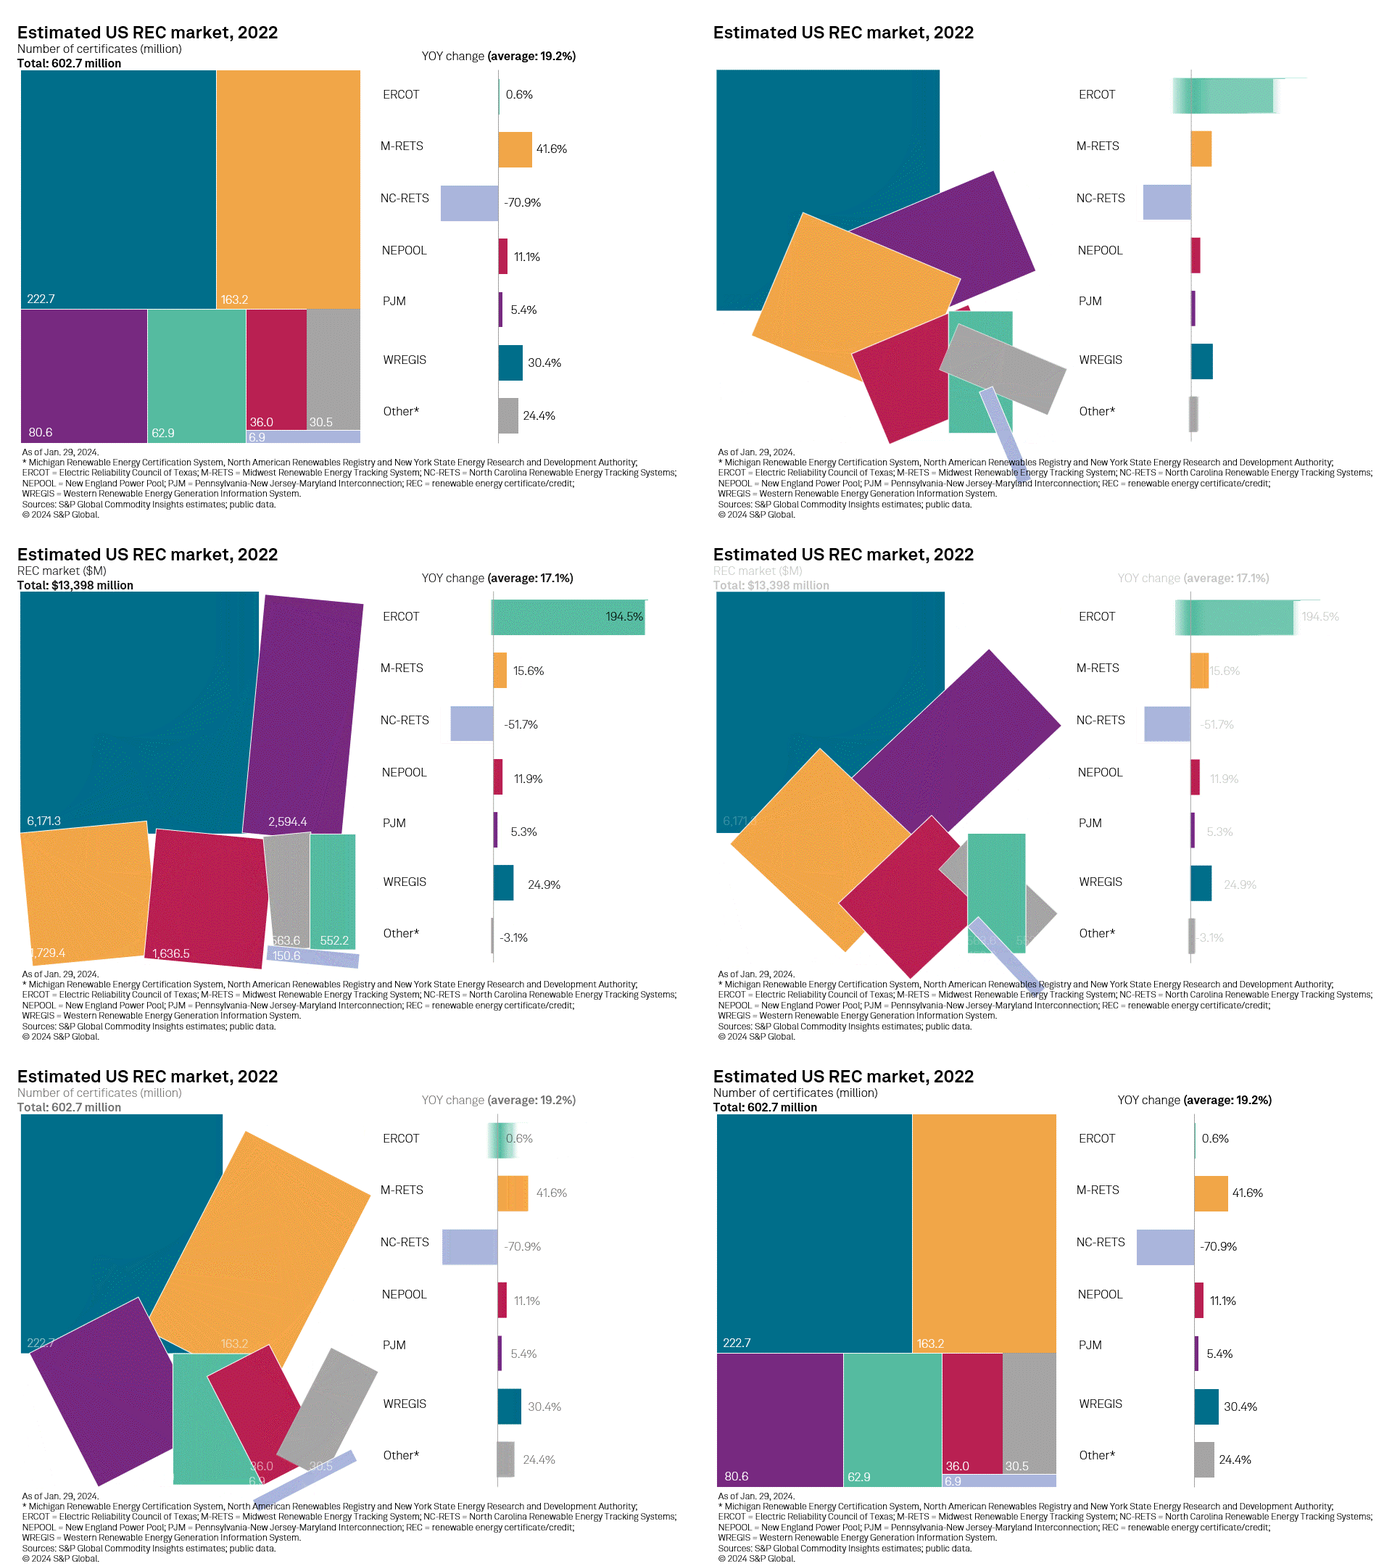
Fueled by long-term tax credits from the Inflation Reduction Act of 2022, increasing state-level clean energy targets, and lucrative prices for solar carve-outs and offshore wind, the US renewable energy credit market is expected to grow at a 10% compound annual growth rate from 2024 through 2033, at least tripling in size from 2022 levels.
Based on full-year data from regional renewable energy credit (REC) tracking systems and compliance reports for 2022 — the most recent year for which comprehensive data is available — we estimate that the US REC market, powered by higher prices and a 19.2% jump in retired credits (also known as certificates), grew $1.95 billion annually from 2021 levels, topping $13 billion. As in 2021, the West led the market, accounting for 36.9% of credits retired and 46.1% of the estimated 2022 US REC value.
REC tracking data shows the PJM Interconnection LLC, the Midcontinent ISO and ISO New England were the next three largest REC markets in the US in 2022, thanks to higher-priced compliance credits from states with renewable portfolio standards.
Across the US, compliance again accounted for the bulk of the tracked retired credits; although, at an estimated 57.0% in 2022, its share of the total was down 6.5 percentage points year over year. Further erosion is anticipated in the next 10 years as unmandated renewable generation ramps up.
Overall, forecast REC generation is expected to rise from over 950 million MWh in 2024 to just under 2.7 billion MWh by 2033. Generation contributions from wind and solar combined are projected to jump 10.8 percentage points from 81.7% to 92.5% over the interval. The steep increase in renewable output drives both our base case and upside case scenarios, with the latter suggesting a US REC market close to the $50 billion mark by 2033, almost $10 billion higher than the base case.

Regionally, both the West and PJM are forecast to surpass $10 billion in cumulative REC market value by 2033, under the base case scenario. Despite its comparatively small footprint, New York ISO is forecast to reach $7.9 billion, thanks to formidable REC contributions from solar and offshore wind targets. MISO is expected to have the largest 10-year increase in REC market value, more than tripling by 2033. The Electric Reliability Council of Texas Inc., the Southeast, and Southwest Power Pool are also anticipating steady growth throughout the period, but with the majority of generated RECs in these regions expected to be sold into the lower-priced voluntary bucket, these markets round out the bottom three regions in projected 2033 REC value.
Our 2024 US REC market outlook revolves around S&P Global Market Intelligence's fourth-quarter 2023 Power Forecast projections for minimum renewable energy generation to meet renewable portfolio standard targets and overall state-level renewable megawatt-hour production from 2024 through 2033. Both Power Forecast estimates and public data were leveraged to model 10-year REC prices.
Data visualization by Chris Allen Villanueva and Qaiser Ali.
For wholesale prices and supply and demand projections, see the S&P Global Market Intelligence Power Forecast.
Regulatory Research Associates is a group within S&P Global Commodity Insights.
S&P Global Commodity Insights produces content for distribution on S&P Capital IQ Pro.
This article was published by S&P Global Market Intelligence and not by S&P Global Ratings, which is a separately managed division of S&P Global.


