

Background
S&P Dow Jones Indices (S&P DJI), the world’s largest provider of financial market indices,1 was engaged by PenSam, the Danish labor market pension fund, to develop a solution that corrected portfolio construction concerns that it had with its existing climate benchmark. S&P DJI was able to develop a solution that considered:
- A science-based IPCC approach to portfolio decarbonization using Scope 1+2+3 carbon emissions data
- Optimizer capabilities that would limit unwanted risks (including tracking error, active sector/industry deviation and stock concentration)
- Bespoke ESG criteria provided by the client
- Increased exposure to companies with revenues aligned to climate opportunities
To implement the index solution, S&P DJI developed a new bespoke index framework under our beS&P™ capability, which brings new, client-driven index concepts to life.
Looking for ESG Insights tailored to you?
Speak to a SpecialistA Simple Approach to Achieving Net-Zero
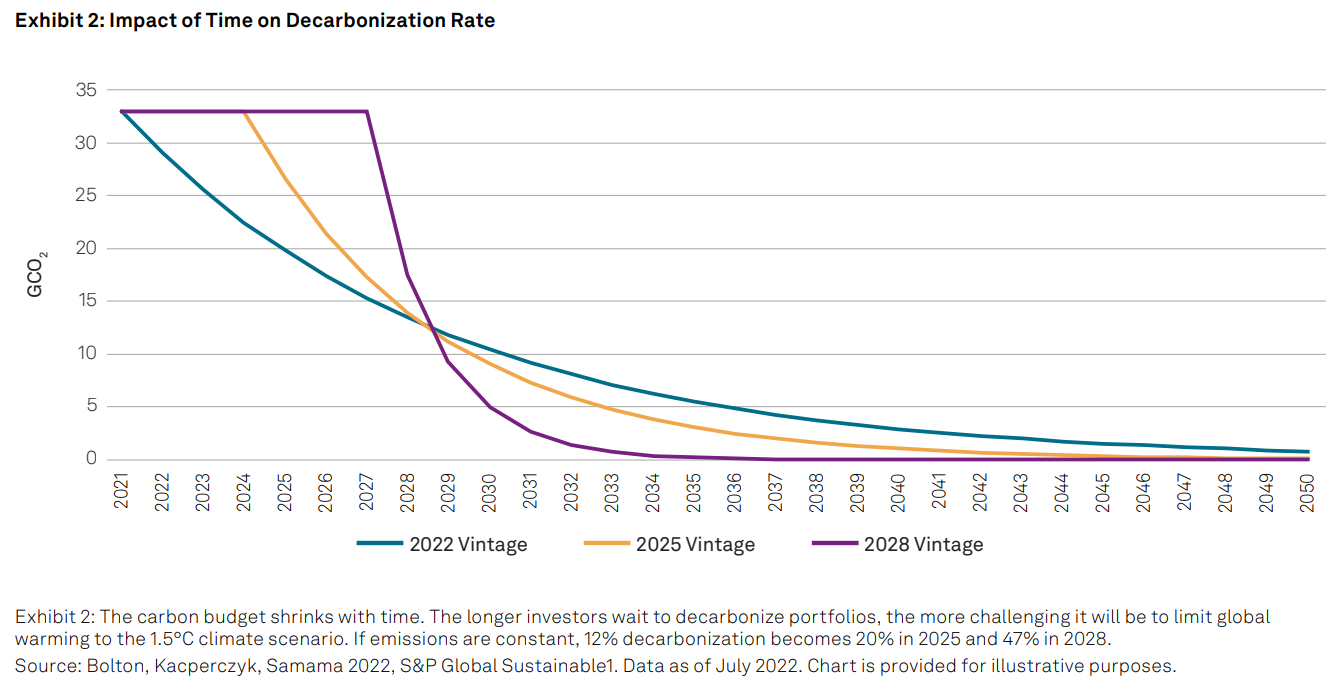
The index methodology developed for PenSam follows a customized version of the S&P Carbon Budget Index (CBI) Series, which was launched by S&P DJI in 2022. The methodology is based on the concept paper, “NetZero Carbon Portfolio Alignment”,2 which makes the case for the cost of delay. The paper references the Intergovernmental Panel on Climate Change’s (IPCC) argument that limiting global warming from pre-industrial levels to 1.5°C with an 83% probability by 2050 means that the planet has a remaining carbon budget of 300 GtCO2 as of 2020.3 In 2022, this implies a reduction in the volume of CO2 by 12% year-over-year in order to achieve this goal. This approach may be mirrored in a diversified index by observing the carbon footprint of companies every year; if companies are able to reduce their footprint in-line with this goal, then the index weights may remain the same—however, for cases in which corporates, not individually but overall, fail to achieve the required targets, the index will be reweighted such that the carbon ownership will still be reduced by 12%. As the carbon budget shrinks with time, if investors delay action and companies do not reduce emissions accordingly, then the required 12% decarbonization will become 20% in 2025, and 47% in 2028. Despite the rapidly depleting carbon budget, the S&P CBI methodology offers a high level of flexibility by allowing custom decarbonization pathways that cater to clients’ initial and final carbon reduction goals. For example, the index designed for PenSam applies an initial 70% carbon reduction that is followed by a 7% year-over-year reduction compatible with the 2024 Vintage4 model. Furthermore, there is a floor to the reduction level, as there will always be emissions in 2050 that will then have to be captured.
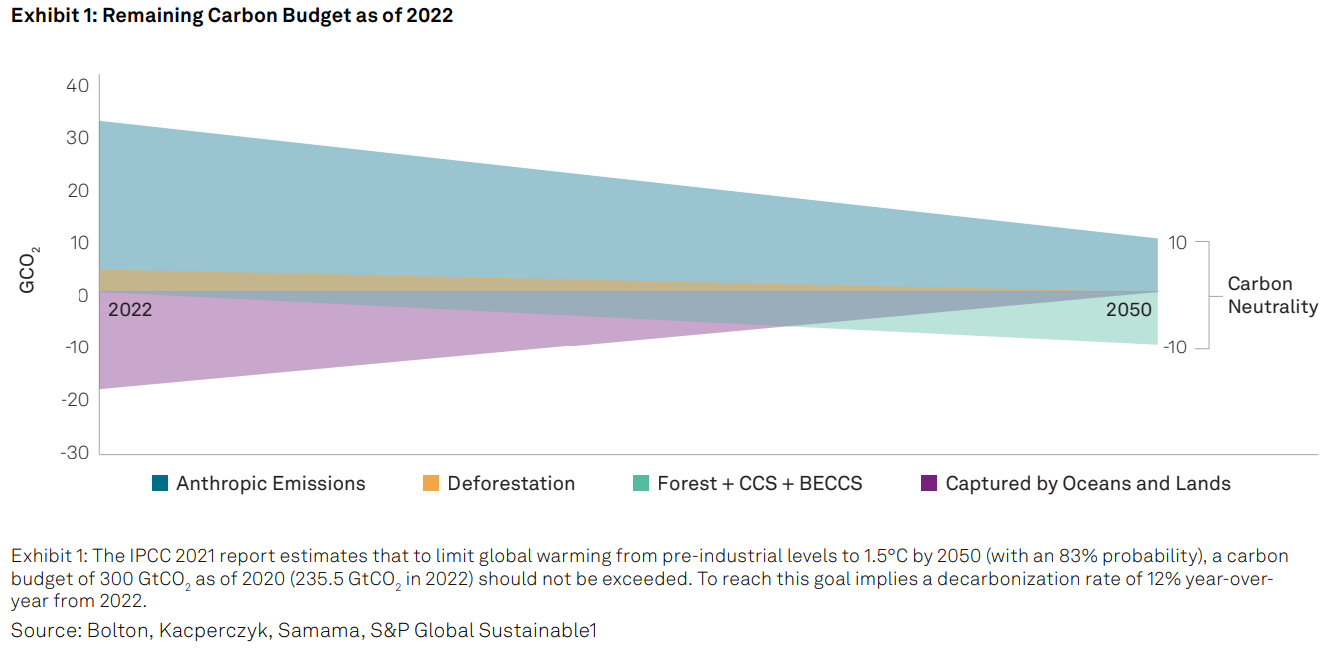
Despite the rapidly depleting carbon budget, the S&P CBI methodology offers a high level of flexibility by allowing custom decarbonization pathways that cater to clients’ initial and final carbon reduction goals.
Combining Sustainability Objectives with Risk Management
Quality of data is always an important consideration when integrating sustainability criteria within a transparent index methodology. Trucost Scope 1+2+3 Carbon Emissions data was used to integrate the decarbonization pathway targeted within the S&P CBI. Trucost data is provided by S&P Global Sustainable1. Additionally, S&P DJI partnered with Impact Cubed, a London-based provider of sustainability impact data and analytics, to increase the exposure to companies demonstrating evidence of business activities linked to climate solutions through its Climate Impact Revenues dataset.5
Finally, PenSam was also able to embed a list of custom exclusions within the index through the beS&P framework. It was critical for the integration of sustainability characteristics not to result in high unwanted risks taken vis-à-vis the benchmark universe, which might include:
- Single-stock exposure
- GICS® sector exposure
- GICS industry exposure
- Country exposure
To achieve this goal while meeting the sustainability objectives from the S&P CBI, S&P DJI’s glass-box optimization6 was used to minimize these unwanted exposures in the index while achieving a clearer relationship between the carbon data and the resultant index weights. The index methodology was back-tested, resulting in low realized tracking errors (<1%). The solution was then tested using simulated decarbonization trajectories through 2050, assuming constant emissions from companies, index constituents, as well as variances and covariances between risk factors. Under these assumptions, the global index had a maximum simulated tracking error of under 2% relative to its benchmark index, with limited active sector exposures in 2050.
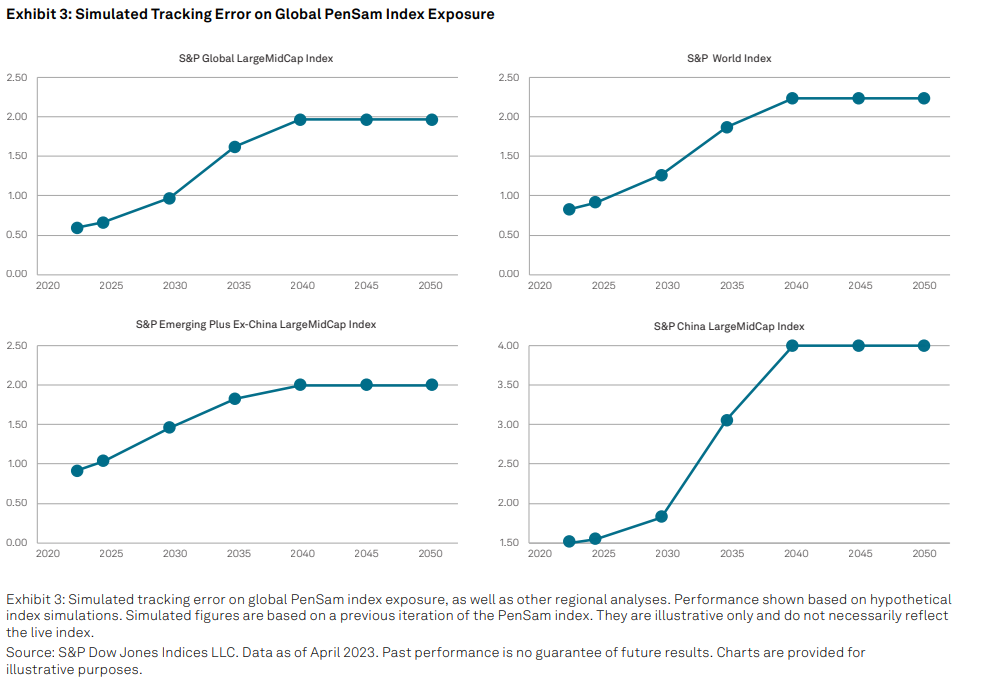
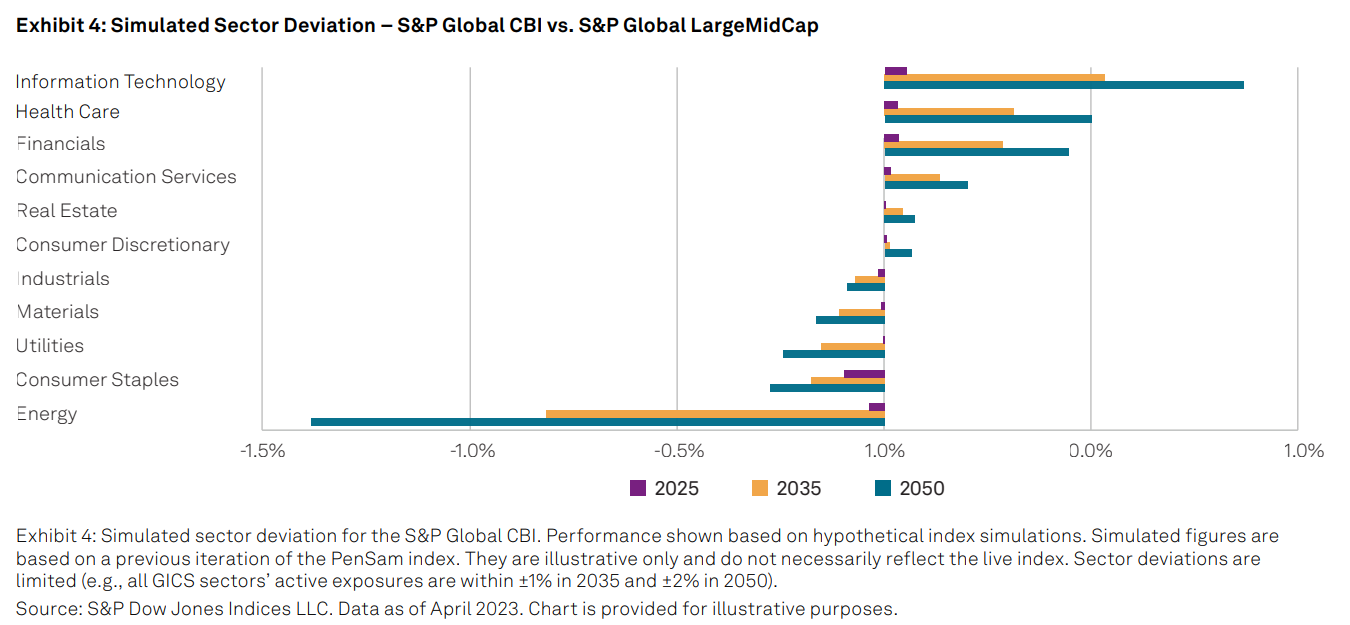
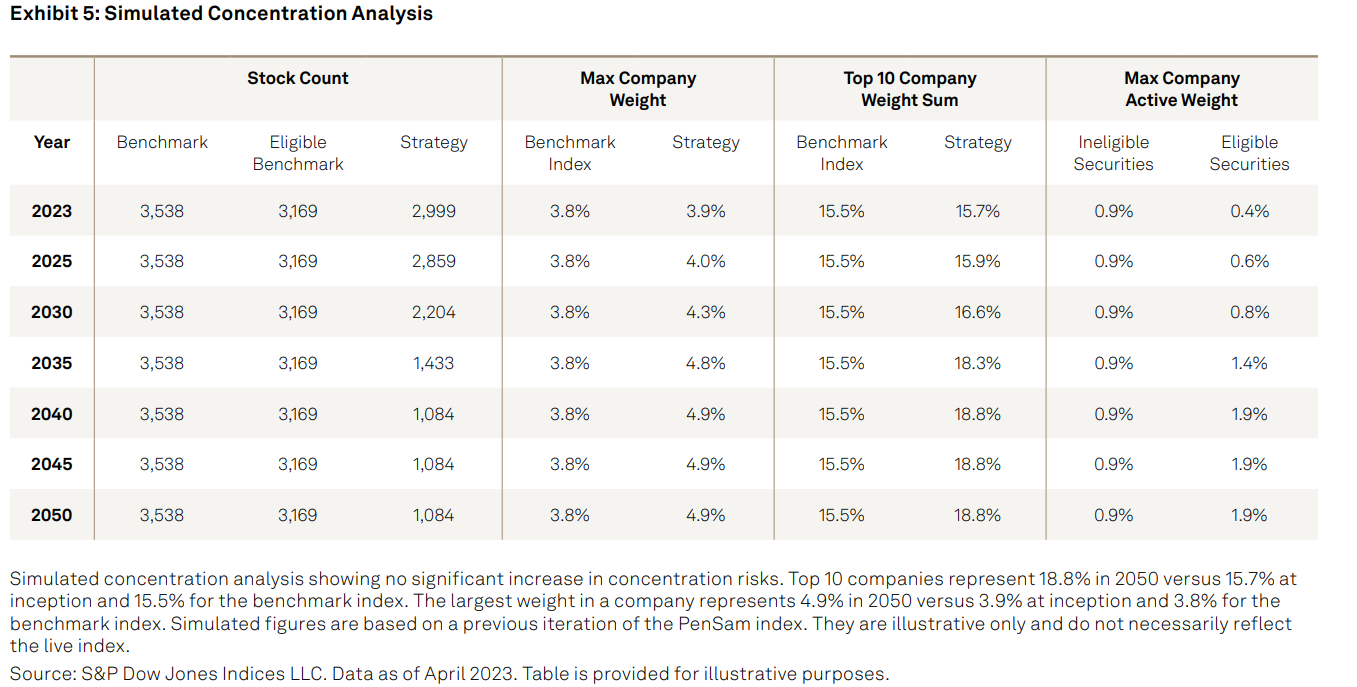
Exhibit 5 shows that the simulations result in low concentration risk. The maximum constituent active weight in the simulated 2050 scenario would fall within less than 2%, with over 1,000 constituents remaining in the index. Finally, the average yearly one-way turnover was found to be less than 10%, and although turnover is not explicitly controlled for, the glass-box optimizer seeks to minimize active share to the float-adjusted market capitalization-weighted index and, as such, naturally benefits from the low turnover of the benchmark index.
beS&P: Offering a Customized Framework
Historically, traditional indexing solutions have been standard in nature, with limited scope for advanced customizations, such as incorporating specific exclusion policies or withholding tax considerations for certain tax-exempt entities. PenSam brought its discretionary index requirements to life through the beS&P framework, which offers flexible, quickto-market, bespoke solutions within a robust governance structure. Additionally, PenSam was able to build on S&P DJI’s standard index methodology, as well as integrate multiple datasets to enhance the sustainability profile of its portfolio. Last but not least, this partnership shows how investors with decarbonization objectives can implement a science-based approach, leveraging IPCC while also limiting portfolio construction risks and integrating the cost of delay.
1 Source: S&P Dow Jones Indices Survey of Indexed Assets 2022
2 Patrick Bolton, Marcin Kacperczyk and Frédéric Samama: Net-Zero Carbon Portfolio Alignment, Financial Analysts Journal (2022).
3 V. Masson-Delmotte, P. Zhai, A. Pirani, S.L. Connors, C. Péan, S. Berger, N. Caud, Y. Chen, L. Goldfarb, M.I. Gomis, M. Huang, K. Leitzell, E. Lonnoy, J.B.R. Matthews, T.K. Maycock, T. Waterfield, O. Yelekçi, R. Yu and B. Zhou (eds.): Climate Change 2021 – The Physical Science Basis: Contribution of Working Group I to the Sixth Assessment Report of the Intergovernmental Panel on Climate Change (2021).
4 The “Vintage” denotes the launch year of the strategy to take into account the most recent carbon budget assumptions within the index methodology, based on the IPCC budget and what will have been spent in the meantime.
5 Please see ImpactCubed for additional information.
6 S&P Dow Jones Indices, Leonardo Cabrer and Akash Jain, Glass-Box Optimization: Bringing Clarity to Sustainability Indices, Jan. 3, 2024.