

In 2020, the energy sector was responsible for approximately three-quarters of global greenhouse gas (GHG) emissions. This puts a tremendous responsibility on the sector and those that support it to play a crucial role in the transition to net zero. As a growing number of financial institutions commit to reducing financed emissions, it has become critical that they understand the current carbon footprint and long-term climate impact of their investments.
Sustainability is a large part of the mission and culture of this global investment bank and financial services firm. It is a member of the UN-convened Net-Zero Alliance (NZBA), a group of global banks that is committed to aligning their lending and investment portfolios with net zero emissions by 2050. It is also a member of the UN-convened Net-Zero Asset Owner Alliance, an international group of institutional investors committed to transitioning their portfolios to net zero over the same timeframe.
The corporate ESG team at the firm was charged with calculating and tracking the emission intensity of assets in its energy investment portfolio. This was to reflect a net zero emissions scenario that shows a narrow, but achievable, pathway for the global energy sector to achieve emission neutrality by 2050. It was clear that the team needed to expand its data and analytic capabilities to undertake this important sustainability work.
Pain Points
The large-scale and complex nature of climate and sustainability decisions, coupled with the lack of sufficient, reliable and concise data, was making it challenging for members of the ESG team to assess the firm’s energy investment portfolio. To achieve their goal of net zero emissions by 2050, they required:
- Access to extensive data and analytics on greenhouse gas (GHG) emissions at regional, sector, corporate and asset levels to evaluate the carbon footprints of investments and identify climate-related risks across the portfolio.
- Data that has been standardized to support consistent comparisons and peer group benchmarking.
- The ability to track a company’s journey towards net zero targets and perform climate scenario analyses to test the portfolio's resilience to financial risks associated with climate change.
The head of the investment team had heard that IHS Markit had become part of S&P Global in the first quarter of 2022, and that S&P Global Platts and IHS Markit Energy & Natural Resources had combined to become S&P Global Commodity Insights ("Commodity Insights"). He reached out to Commodity Insights to learn more about its capabilities in the GHG arena
The global race towards decarbonization is underway and emission-related data has become a key pillar in efforts to reduce GHG emissions worldwide to net zero by 2050.
Looking for ESG insights tailored to you?
Speak to a SpecialistThe Solution
Specialists from Commodity Insights first provided an overview of the new organization that has brought together S&P Global and IHS Markit in a merger of equals. The combined capabilities deliver a complementary portfolio of commodity benchmark prices, asset and market data, forward-looking analytics and consultative capabilities to provide insights on global energy markets and the ongoing energy transition. They then discussed the Corporate Emissions Solution, which is part of the Carbon and Environments Energy Transitions package, that offers standardized data and analytics on GHG emissions across the energy value chain and industrial sectors to assess climate risks, support investment decisions and benchmark decarbonization performance. The Corporate Emissions Solution would enable the ESG team to:
Gain transparency into emissions data across the energy value chain
Global cross-sectoral coverage of emissions data at the asset level includes:
- Oil and gas exploration and production
- Oil and gas gathering, transportation, processing and refining.
- Power generation, agriculture, fertilizers and biofuels.
Assess the carbon footprint of a facility, company or portfolio
Granular data points are standardized and harmonized to support consistent analysis and cover:
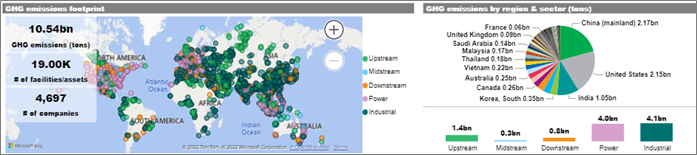
- 10 billion tons of GHG emissions (CO2e) mapped in 50+ countries, as shown in the figure below.1
- 50,000+ facilities and 5,000+ companies across the energy and industrial sectors.
- Details on asset-to-parent company emissions and links with ISIN and LEI identifiers2 to support portfolio analysis.
Track emissions profiles of portfolio holdings over time
Time series emissions data starts in 2010 and extends to 2030.
Gain important insights to drive scenario analysis
The Solution provides key inputs needed for scenario analysis:
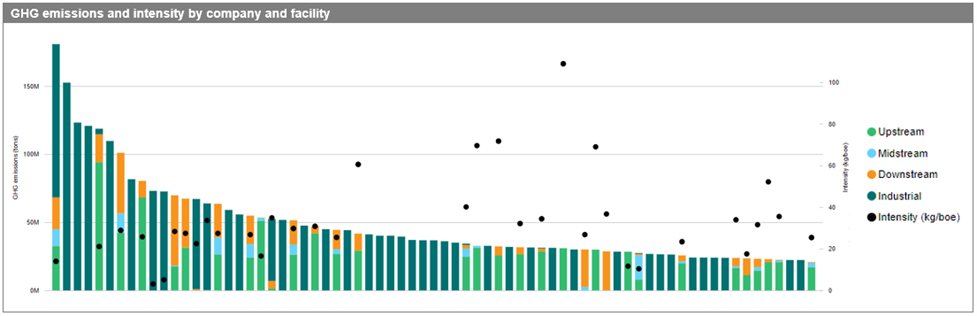
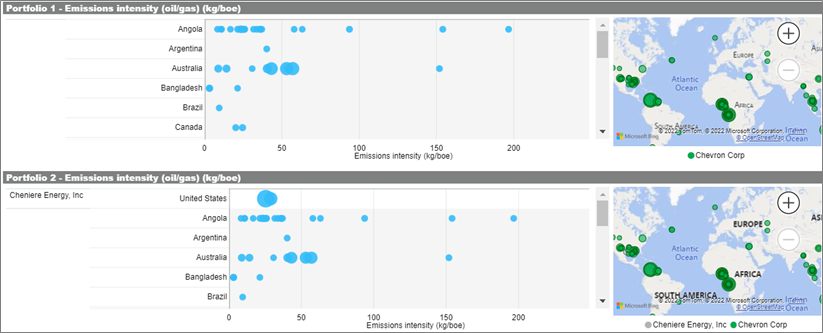
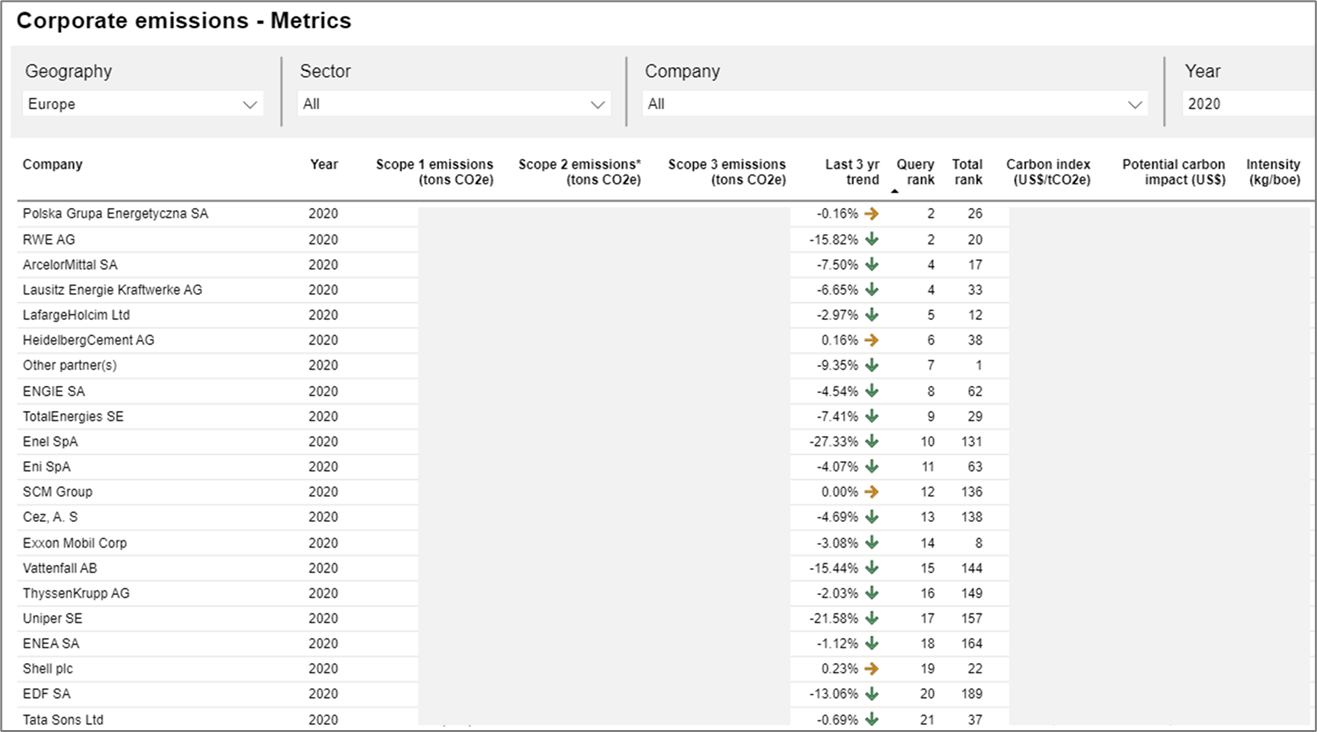
- Absolute emissions and emission-intensity metrics reported at an asset level, as shown in the figure below with names redacted.
- Scope 1 (direct) and 2 (indirect) emissions reported on a gross operational and net equity basis (i.e., based on the percent of an asset that an entity owns).
- Scope 3 emissions.
- Emissions sources, such as flaring, venting and combustion.
- Primary asset-level input/output product segmentation (i.e., biofuel, coal, fertilizer, gas, liquid and more).
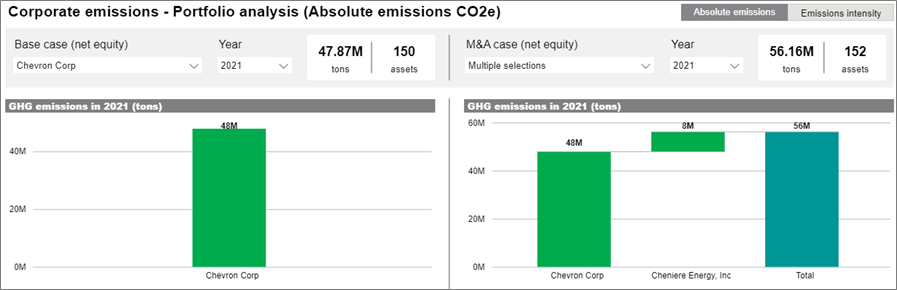
Simulate carbon efficiency gains at a portfolio level
Functionality within the dashboards enable users to compare a base case scenario with an M&A scenario to see the impact of adding/excluding assets on overall emissions of the portfolio, as shown in the figure below.
Track a company's progress on net zero and benchmark against peers
Net zero targets and metrics to 2030 are presented for the are extracted from sustainability reports. This includes such things as Scope 1, 2 and 3 emissions, carbon price assumptions and net zero base year and percent reduction target, as shown in the figure below.
Choose from multiple data delivery options
The Commodity Insights Connect Platform provides analytical dashboards to quickly access and view Information, a robust data query tool that enables users to filter data by geography, sector and company to prepare customized reports and more. This is complemented by an API option that provides on-demand enterprise data access securely and with few resources, enabling users to pick and choose the data needed without hosting a database.
Gain unrivalled support
The support of our wide-ranging team of experts is unparalleled, backed by deep knowledge and expertise in data, analytics and global emissions markets.
Get comprehensive data intelligence
Learn moreKey Benefits
Members of the ESG team saw many benefits to the Corporate Emissions Solution and subscribed to the offering. They are now able to:
- Save an enormous amount of time with ready access to standardized data and analytics on corporate GHG emissions across the global energy value chain and industrial sectors.
- Create transparency into GHG emissions at the regional, sector, corporate and portfolio level to support decarbonization efforts to meet the stated net zero goal by 2050.
- Track progression to this net zero goal over time under different scenarios with a much higher level of confidence to support reporting and compliance requirements.
- Guide ongoing investment decisions to avoid assets that lack a sustainability strategy that would take the portfolio off track.
- Rely on the support of highly experienced Commodity Insight specialists who understand the global emissions market.
Click here to explore some of the datasets mentioned in this Case Study.
-
-
Uncover risk scenarios, reveal transition pathways, and optimize your net zero opportunities.
Accelerate to zero -
1All graphics are from Commodity Insights and are for illustrative purposes only.
2ISIN=International Securities Identification Number; LEI=Legal Entity Identifier.