Continued inflation and market volatility impacted dealmaking in 2022. Equity issuance and M&A volumes dropped notably year over year. The hot streak that healthcare dealmaking rode in 2021 cooled off. Read the following preview of our infographic to view interactive graphs of key investment banking trends from 2022, including M&A volumes by sector, equity issuance totals, healthcare market activity, and leveraged buyouts.
M&A Activity by Industry
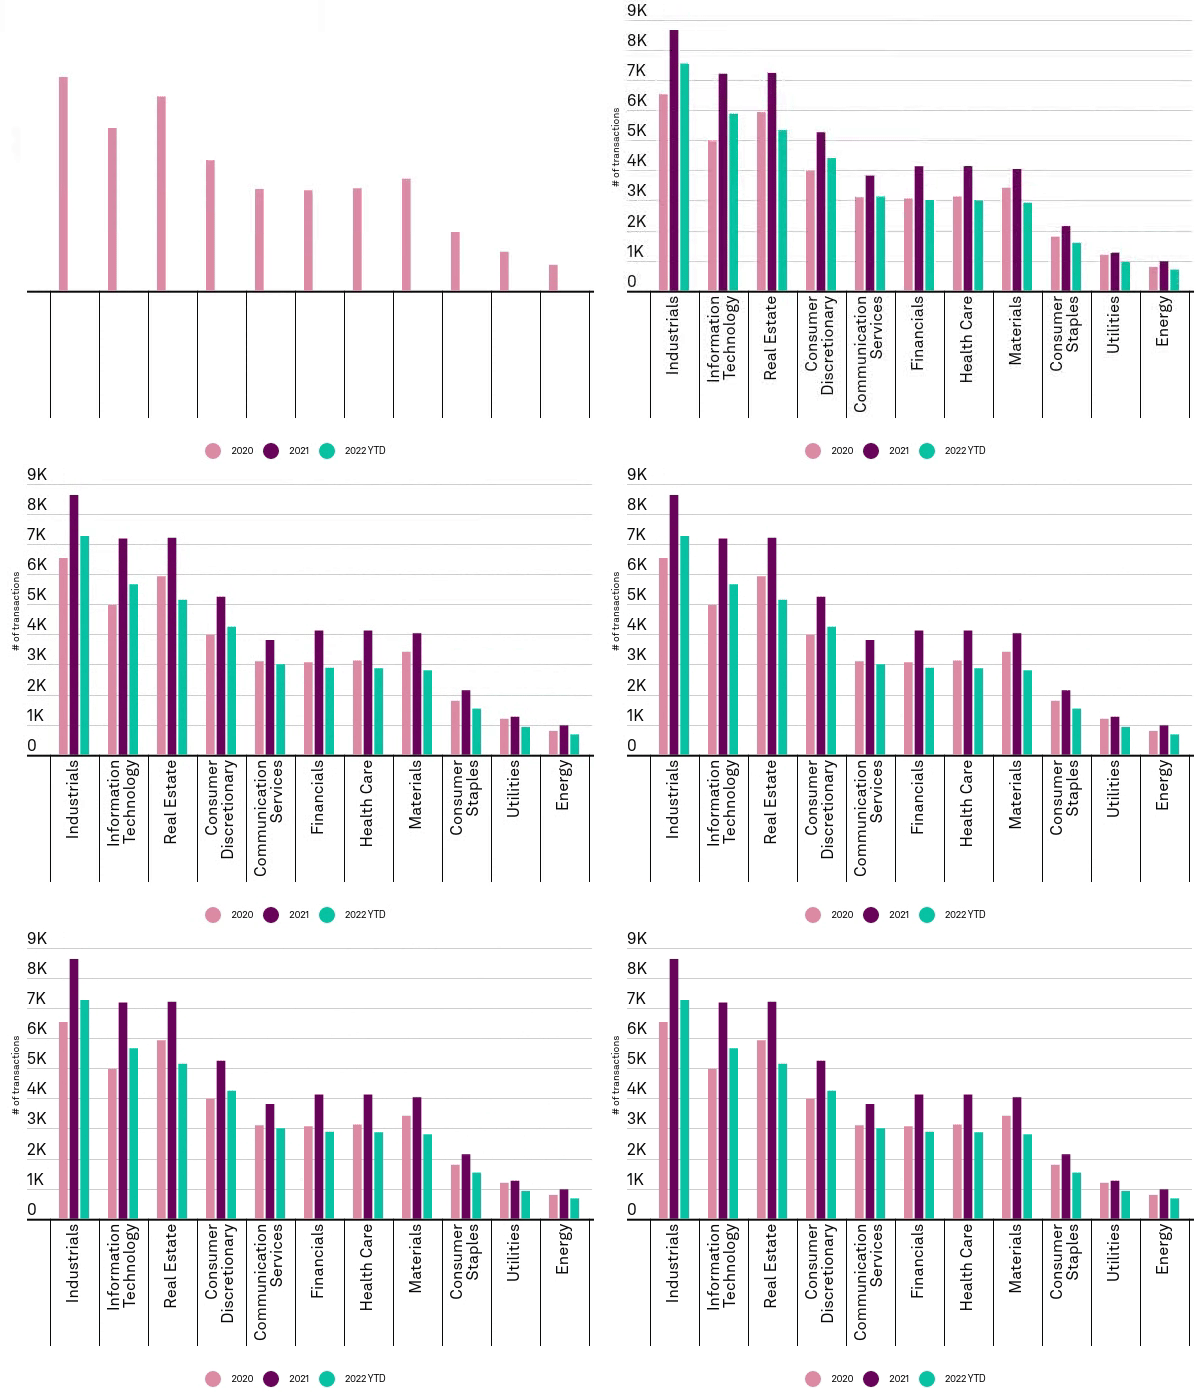
Real Estate and Information Technology have been the top sectors in terms of transaction value in 2022 year-to-date, generating $353 billion and $349 billion in total deal value, respectively. This year saw a decrease in deal value across all industries.
Industrials sector proved to be the most active M&A market with 7,274 deals recorded in 2022 YTD, but that total is down 16% compared to last year's 8,634 deals. Information Technology and Real Estate follow with 5,670 and 5,148 total deals, respectively, while Energy saw a 31% decline in activity. In the next section, we take a deeper dive on the Healthcare sector.
Graph 1: M&A Deal Totals by Industry

Industry Spotlight: Healthcare M&A Transactions
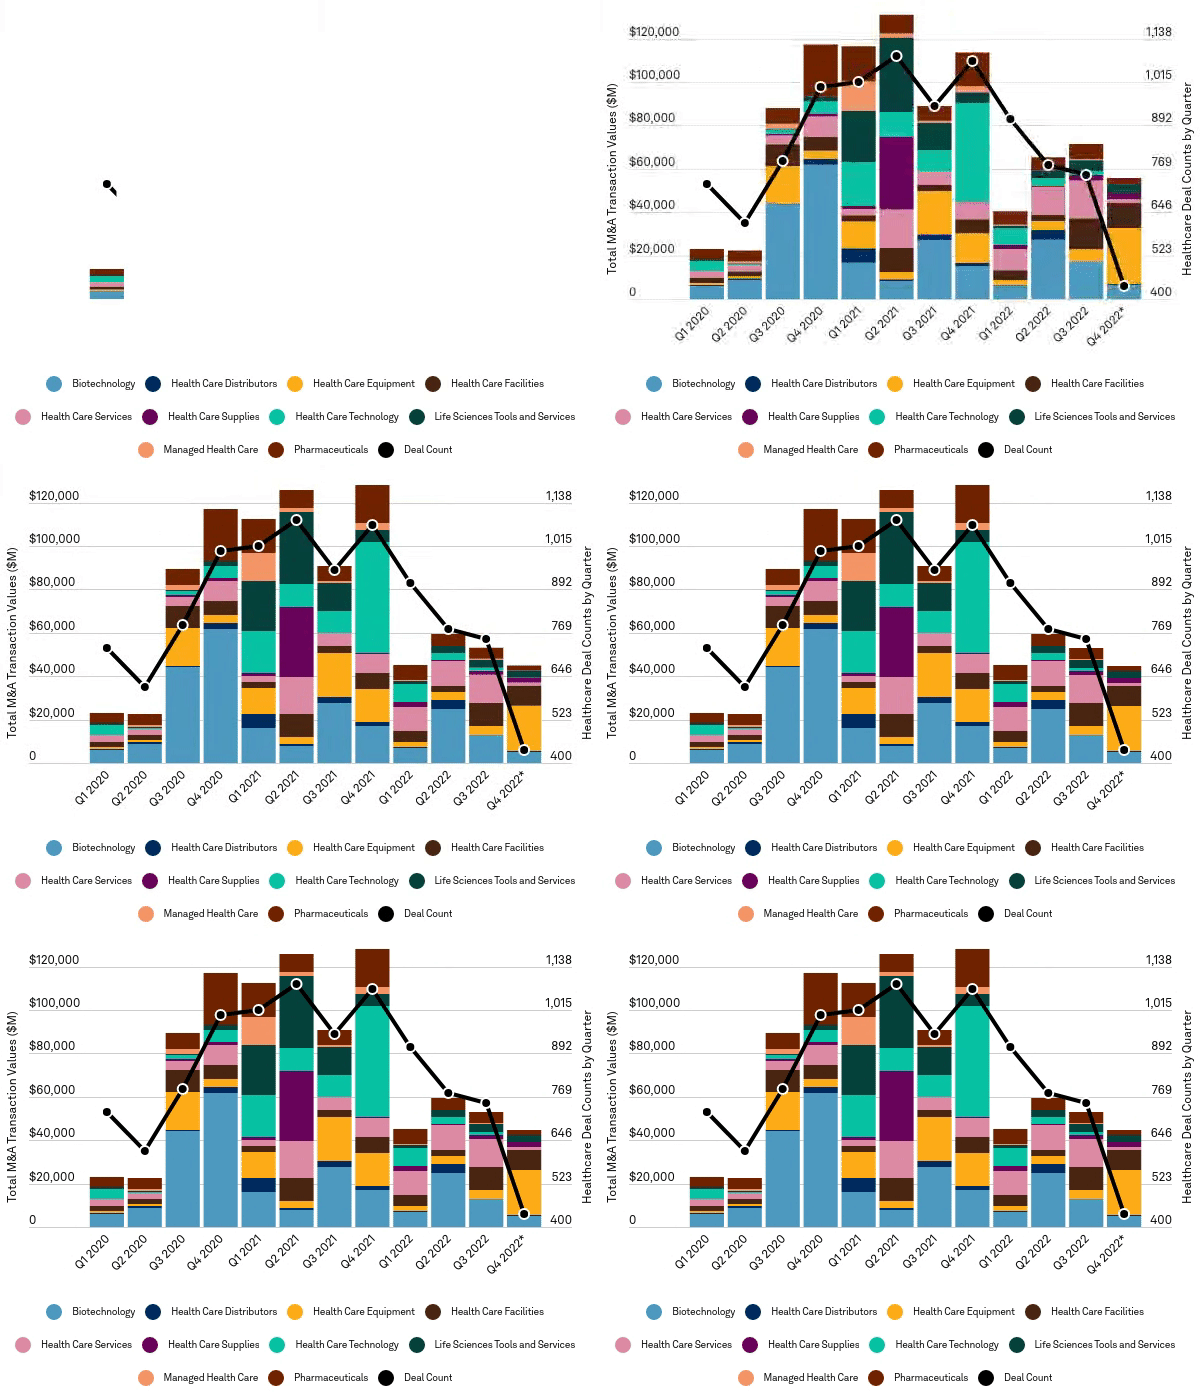
The global slowdown in M&A is evident in the Healthcare industry, as that sector's deal volume declined by 30% (2,878 total deals) and aggregate deal value dropped 56% ($202 billion) in 2022 year-to-date. Healthcare Services, Healthcare Facilities and Healthcare Technology contributed to 60% of all deals this year, while Biotechnology accounted for 25% of the total deal value. Companies in the Healthcare industry received $81 billion in funding across 5,610 deals in 2022 YTD, a 50% decline from funding received the previous year ($162 billion across 7,819 deals).
Graph 2: Healthcare M&A Deal Volumes by Sub-Industry

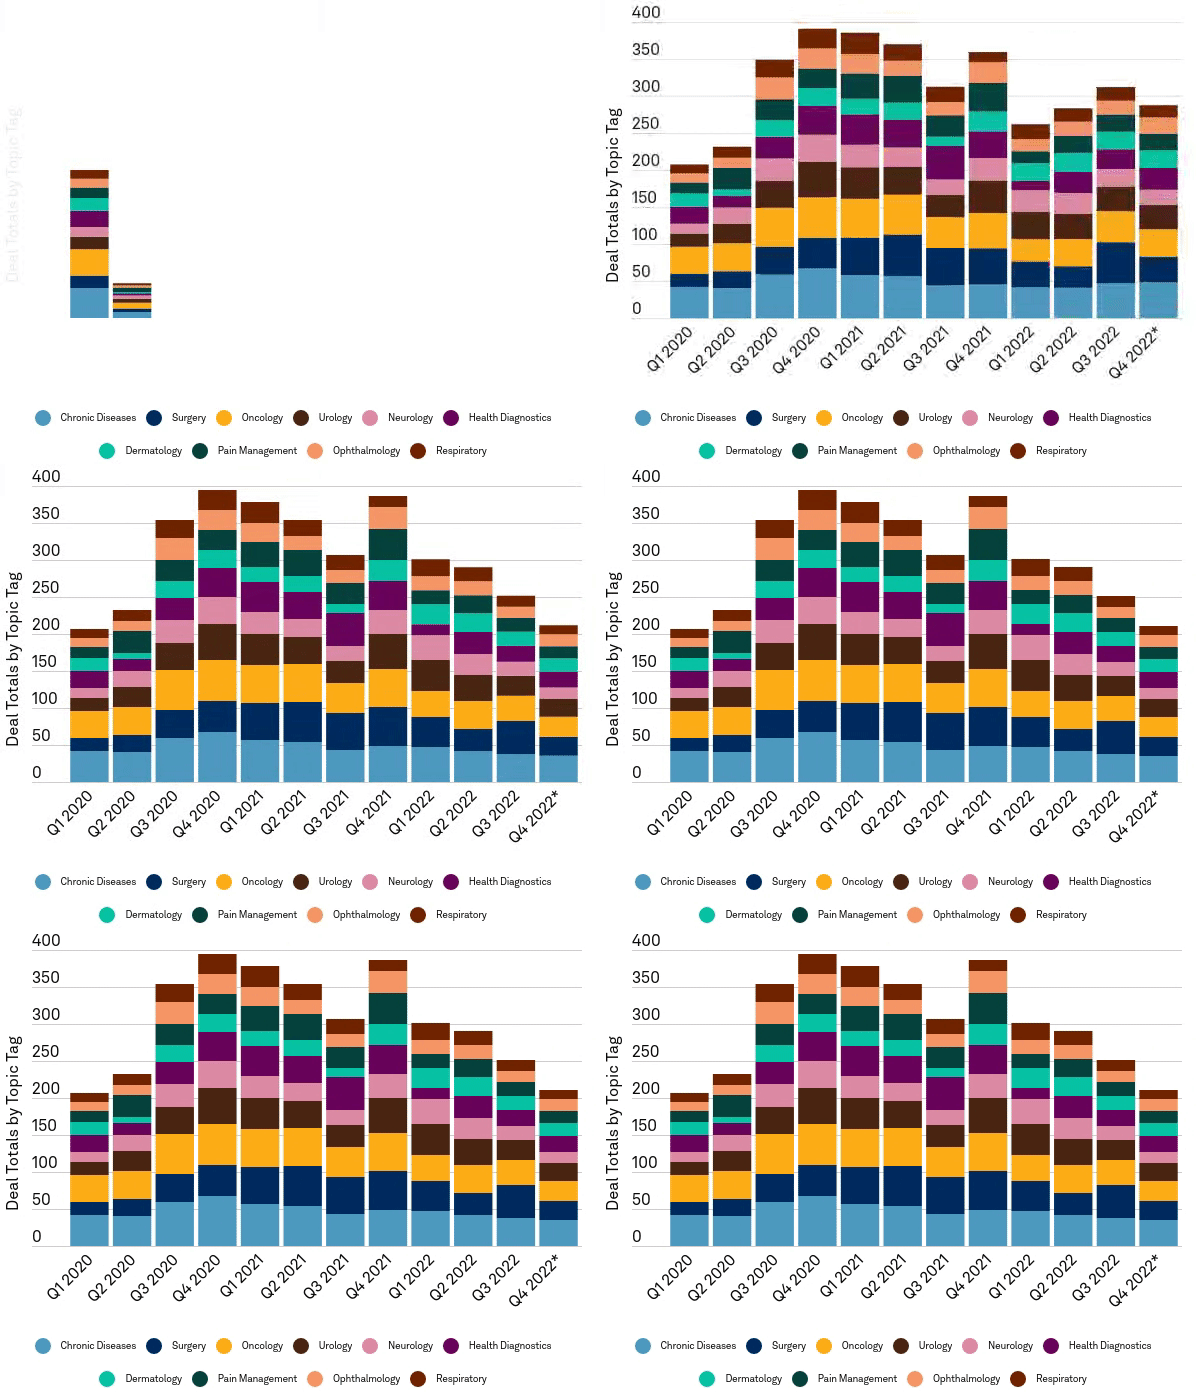
Topic Tags are niche industry classifications available on the S&P Capital IQ Pro platform that provide deeper insights into a company’s operations than standard industry classifications. Topic Tags are generated and updated based on keywords within S&P business descriptions using an AI-based model. Looking at S&P Capital IQ Pro's topic tags, the largest number of healthcare M&A deals completed in 2022 year-to-date involved Chronic Disease and Surgery target companies with 162 deals and 140 deals, respectively.
Graph 3: Healthcare M&A Deals by Topic Tag

Leveraged Buyout (LBO) Activity
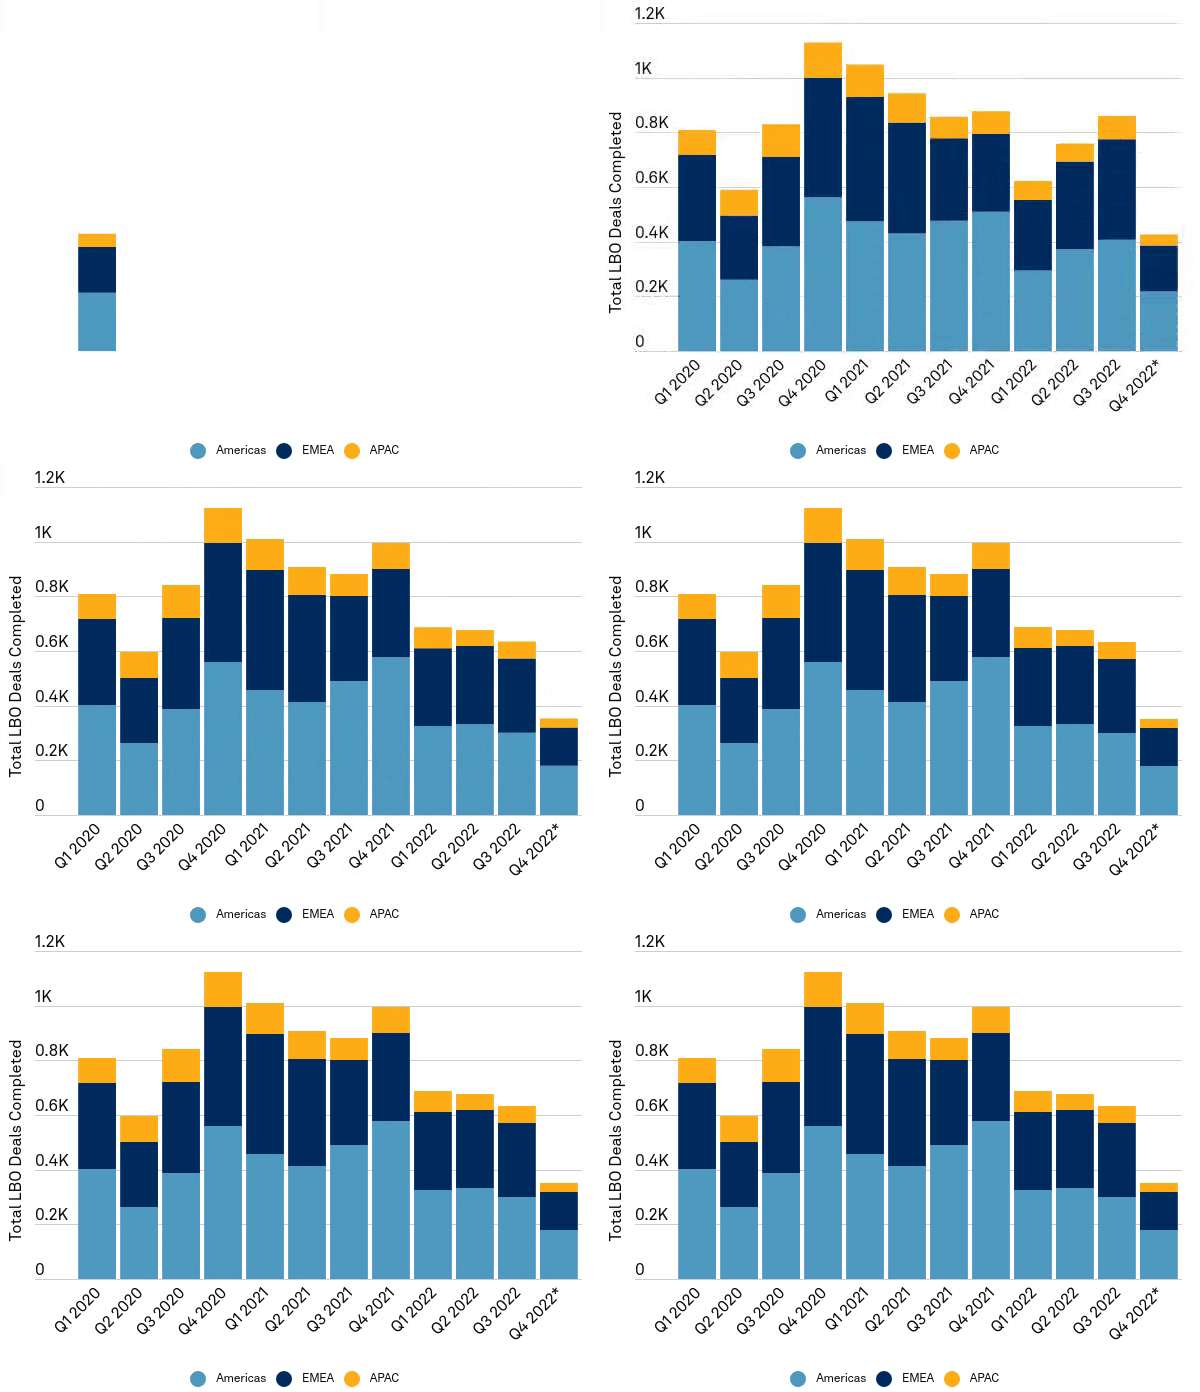
Leveraged buyout (LBO) deal activity is at its lowest point since the onset of the pandemic in 2020, with a total of 353 deals announced or completed globally in Q4 2022. LBO deals issued in Q4 2022 declined by 64% year over year, while total deals in 2022 YTD fell by 38% compared to 2021 (2,350 vs 3,791 deals).
Graph 4: LBO Deals by Region


