
Online video service use in the US has become widespread, with most households using both subscription video on-demand and free, ad-supported video on-demand at 83% and 84%, respectively. Results from S&P Global Market Intelligence Kagan's online consumer survey, conducted in the third quarter of 2023, provides insights into the online video services used, the types of content viewed and most enjoyed on top SVOD services and the use of multichannel services.
This report provides an overview of online video service use data from the survey, along with industry data and forecasts for subscribers and content spending. Access the full report in PDF format here:
State of OTT
– Walt Disney Co.'s Disney+ had the youngest users among the top SVOD services.
– The largest SVOD service cross use was among Warner Bros. Discovery Inc.'s Max users with 79% indicating they also use Netflix.
– Alphabet Inc.'s YouTube had the youngest users among top free VOD services.
– Tubi users tend to also use Pluto TV and vice versa.
– Netflix Inc.'s reported cash content spend dipped slightly in 2022 to $16.66 billion, down 4.6% from $17.47 billion in the prior year. Slowing growth in paid subscribers and revenue prompted a series of strategic moves in 2022 that included launching an ad-supported tier and announcing plans to hold cash content spend to an anticipated $17 billion per year through 2024.
– Since completing most of its global expansion in 2016, Netflix has repeatedly hiked the price of its plans, with emphasis on its largest markets.
– Prime subscribers in the US grew to an estimated 109.3 million in 2022, up 1.3% from 108 million in 2021. Prime subscriber growth surged in 2020 during the pandemic, serving to pull forward some subscriber growth that would have otherwise been spread more evenly across 2021 and 2022.
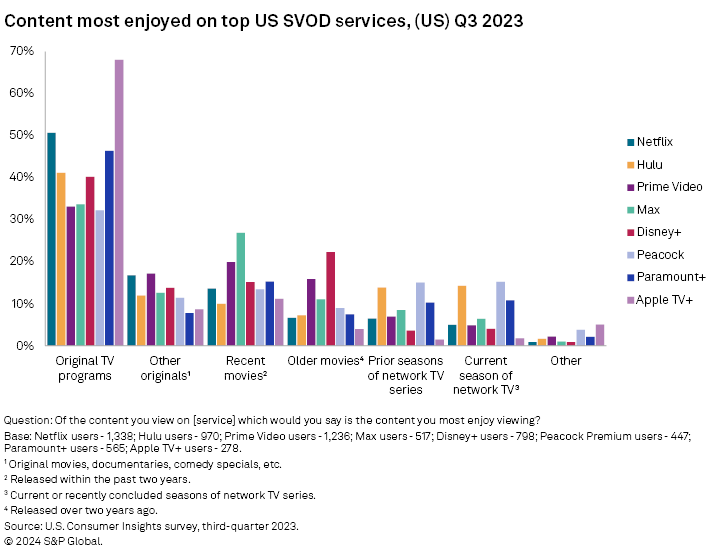
Content on OTT
– Over three-quarters (78%) of Netflix users viewed original TV programs, up from about two-thirds (67%) surveyed in 2022.
– Current season network TV, which used to be the most widely viewed content type on Hulu, has declined to only being viewed by 46% of users.
– Recent subscribers to Amazon Prime Video were more likely than other user types to indicate they most enjoy original TV shows on the service.
– Long-term subscribers to Max were more likely to most enjoy original TV programs compared to recent subscribers or users who receive access via another subscription or shared log-in.
– Survey data shows that 2023 was the first year that original TV programming was the most widely viewed content type on Disney+ at 66%.
– Original TV programs were more popular among Peacock users who subscribe to the less expensive, ad-supported tier.
– Paramount+ subscribers on both the ad-free and the ad-supported tiers reported largely similar preferences for their most enjoyed content.
– Shared login users were the least likely to select original TV programs as the content they most enjoy on Apple TV+ at 52%.
– FAST revenue will grow across all major regions, with the US and Canada projected to generate a majority of revenue throughout Kagan's forecast.
OTT in the Home
– Households with children use an average of eight online video services compared to six for households without children.
– Linear TV still represents the largest percentage (38%) of total daily TV/video viewing hours in the US, followed by SVOD. Those watching primarily or mostly live TV spend substantially more time watching TV/video each day than those watching predominantly VOD.
– The percentage of US households that have dropped their traditional pay TV subscription rose eight percentage points to 35% year-over-year.
– The steady stream of pay TV subscriber losses since 2017 turned into a flood during 2023 with multichannel TV subscriptions declining 7 percentage points to 51% year over year.
Data presented in this article is from Kagan's US Consumer Insights survey conducted in the third quarter of 2023. The online survey included 2,500 US internet adults matched by age and gender to the US Census. The survey results have a margin of error of +/-1.9 ppts at the 95% confidence level. Percentages are rounded to the nearest whole number. Gen Z adults are individuals ages 18-25. Millennials are ages 26-42; Gen Xers are 43-57 years old; and baby boomers/seniors are 58 and older.
To submit direct feedback/suggestions on the questions presented here, please use the "feedback" button located above, directly under the title of this article. Note that while all submissions will be reviewed and every attempt will be made to provide pertinent data, Kagan is unable to guarantee inclusion of specific questions in future surveys.
For more information about the terms of access to the raw data underlying this survey, please contact support.mi@spglobal.com.
Consumer Insights is a regular feature from S&P Market Intelligence Kagan.
This article was published by S&P Global Market Intelligence and not by S&P Global Ratings, which is a separately managed division of S&P Global.