
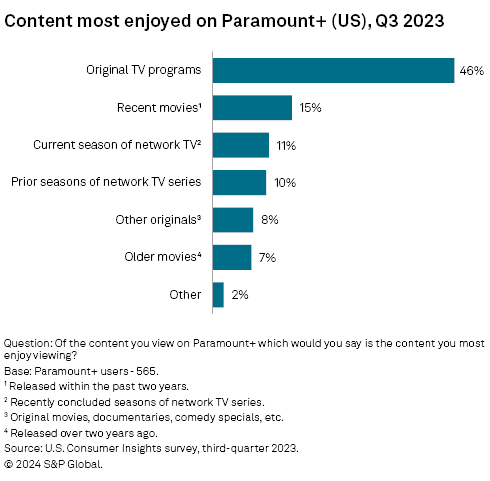
Original TV programs dominated the content most enjoyed across a range of streaming services in 2023, including Paramount+.
Nearly half (46%) of Paramount+ users in S&P Global Market Intelligence Kagan's US Online Consumer survey selected original TV programs as the content they most enjoyed on the Paramount Global streaming service, extending a recurring theme seen among users of several other services, including Peacock Premium, Disney+ and Max. All users were surveyed in the third quarter of 2023.
After original TV programs, the next most enjoyed content category for Paramount+ users was recent movies, with 15% of those surveyed selecting recent movies as their most enjoyed content.

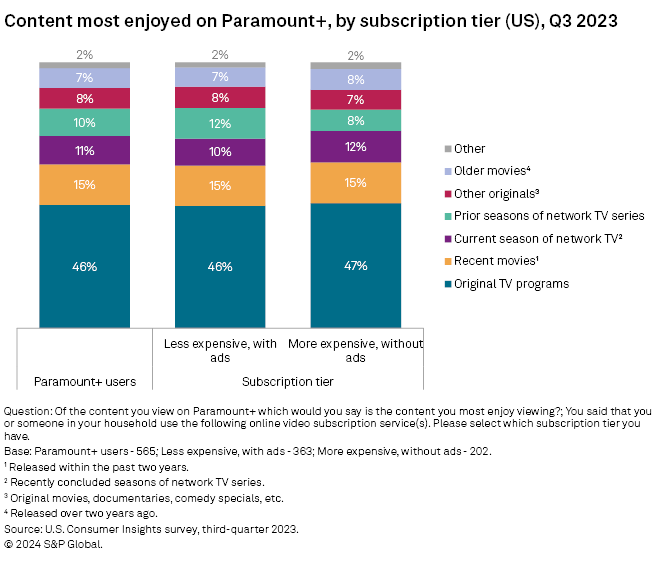
➤ Paramount+ subscribers on both the ad-free and the ad-supported tiers reported largely similar preferences for their most enjoyed content, according to the latest S&P Global Market Intelligence Kagan US Online Consumer survey.
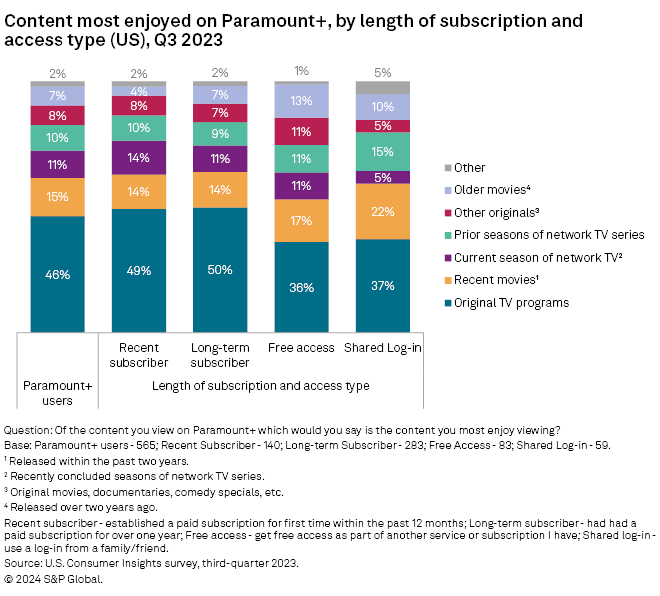
➤ Recent and long-term subscribers were more likely to most enjoy original TV programs compared to users who received access as part of another subscription or shared log-in.
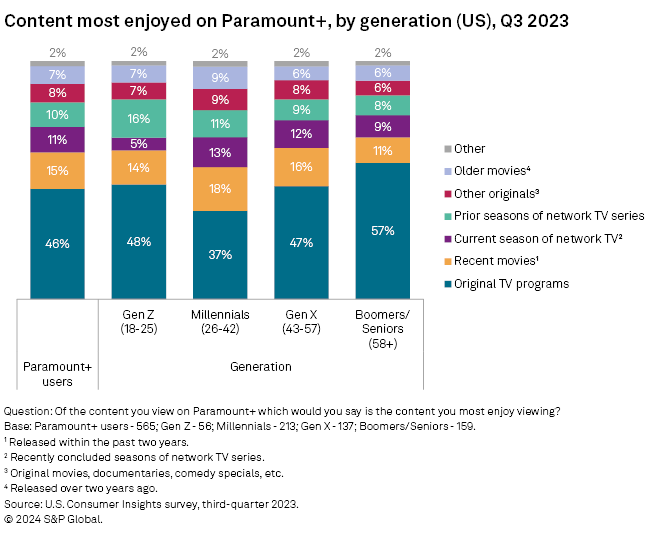
➤ Millennials were the least likely generation to indicate that original TV programs was the content category they most enjoyed on the service, at 37%.

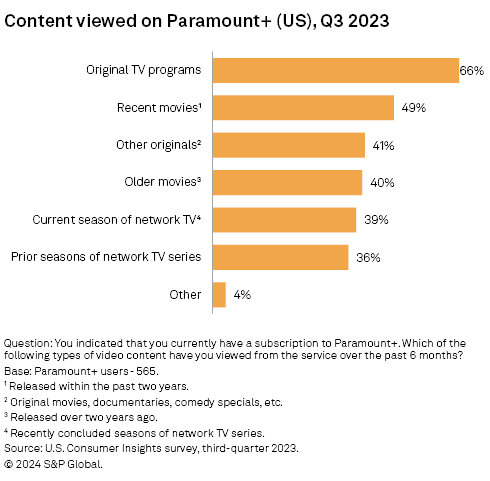
In terms of the content viewed on the service, original TV programs had the largest share at 66%. Recent movies came next at 49%. The other content types were all around the 40% mark, with prior seasons of network TV the lowest at 36%.
There was little variation in the content most enjoyed among subscribers to the two Paramount+ plans. Subscribers to the more expensive, ad-free plan were a little more likely to most enjoy current season network TV at 12% versus 10% for those on the less expensive, ad-supported plan. Subscribers to the ad-supported tier were more likely to most enjoy prior seasons of network TV at 12% versus 8% of those on the ad-free tier.
Half of recent and long-term Paramount+ subscribers selected original TV programs as the content they most enjoyed, at 49% and 50%, respectively. Shared log-in users were less likely to most enjoy original TV programs at 37% but were the most likely to most enjoy recent movies at 22%, and prior seasons of network TV at 15%. Similarly, free access users, who receive access to the service as part of another subscription, had the largest share selecting older movies, at 13%.
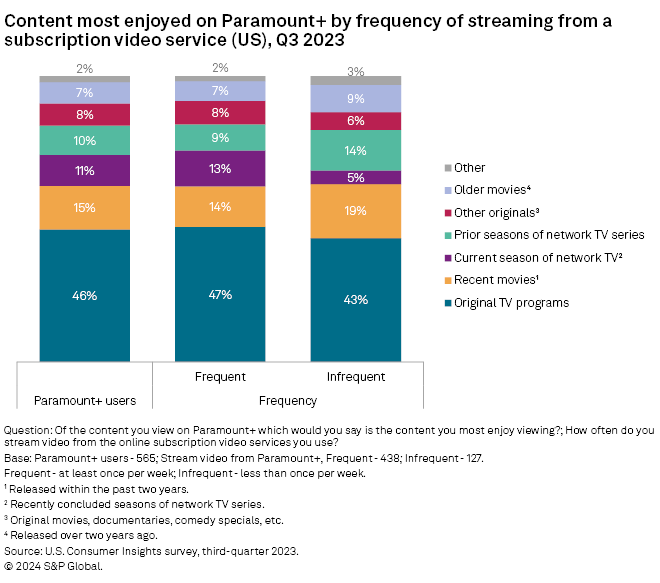
Users who frequently stream from Paramount+, at least once per week, were more likely to most enjoy original TV programs, other originals and current season network TV, compared to infrequent streamers. Infrequent streamers were more likely to most enjoy recent movies at 19%, and prior seasons of network TV series at 14%.
Millennials were the least likely to select original TV programs as the content they most enjoy on the service at 37%, while boomers/seniors were the most likely to select original TV at 57%. Millennials were the most likely most enjoy recent movies at 18% and older movies at 9%. Gen Z users were the most likely to most enjoy prior seasons of network TV at 16%.
Data presented in this article is from S&P Global Market Intelligence Kagan's US Consumer Insights survey conducted in the third quarter of 2023. The online survey included 2,500 US internet adults matched by age and gender to the US Census. The survey results have a margin of error of +/-1.9 percentage points at the 95% confidence level. Percentages are rounded to the nearest whole number. Gen Z adults are individuals ages 18-25; Millennials are ages 26-42; Gen Xers are 43-57 years old; and baby boomers/seniors are 58 and older.
To submit direct feedback/suggestions on the questions presented here, please use the "feedback" button located above, directly under the title of this article. Note that while all submissions will be reviewed and every attempt will be made to provide pertinent data, Kagan is unable to guarantee inclusion of specific questions in future surveys.
For more information about the terms of access to the raw data underlying this survey, please contact support.mi@spglobal.com.
Consumer Insights is a regular feature from S&P Global Market Intelligence Kagan.
This article was published by S&P Global Market Intelligence and not by S&P Global Ratings, which is a separately managed division of S&P Global.