
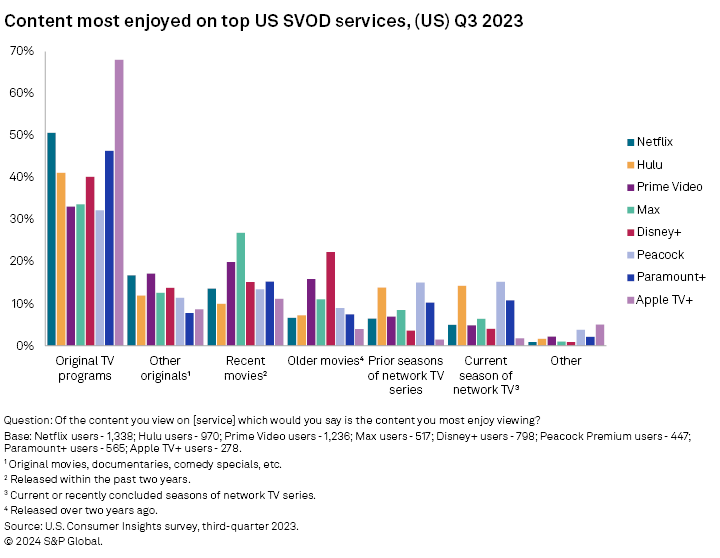
Original TV programs have been a driving force for online video platforms for some time now and users are increasingly indicating that these originals are the content they most enjoy on the top US subscription online video services. According to data from S&P Global Market Intelligence Kagan's US Consumer Insights online survey, conducted in the third quarter of 2023, at least a third of users selected original TV programs as the content they most enjoy on the top US SVOD services. The proliferation of original content across a wide range of services, both paid and free, with ads and without, has likely made users less prone to select licensed or back catalogue content as the programming they most enjoy on many services.

➤ Data from Kagan's 2023 US Consumer Insights survey shows that the share of users selecting original TV programs as the content they most enjoy on top services significantly increased compared to 2022 results for Netflix, Hulu, Prime Video and Disney+.
➤ Peacock Premium, Paramount+ and Apple TV+ were added in the 2023 survey, with Peacock users being the least likely to select original TV programs at 32%.
➤ Nearly half of Paramount+ users (46%) selected original TV programs as the content they most enjoyed on the service.
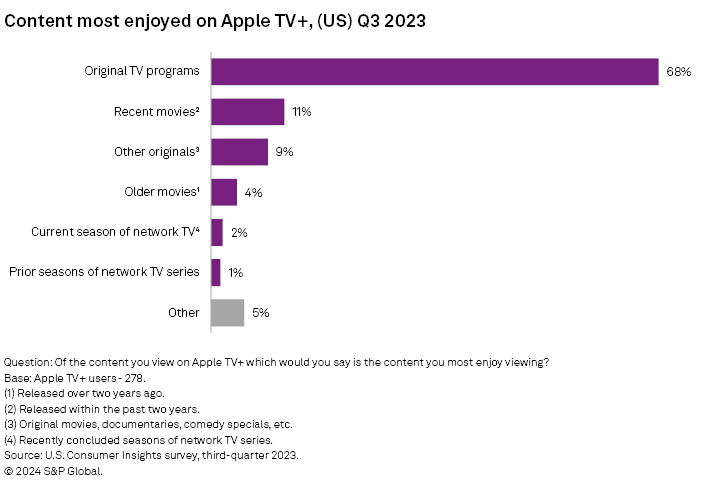
➤ Unsurprisingly, given the content on Apple TV+, 68% of users selected original TV programs as the content they most enjoyed on the service.

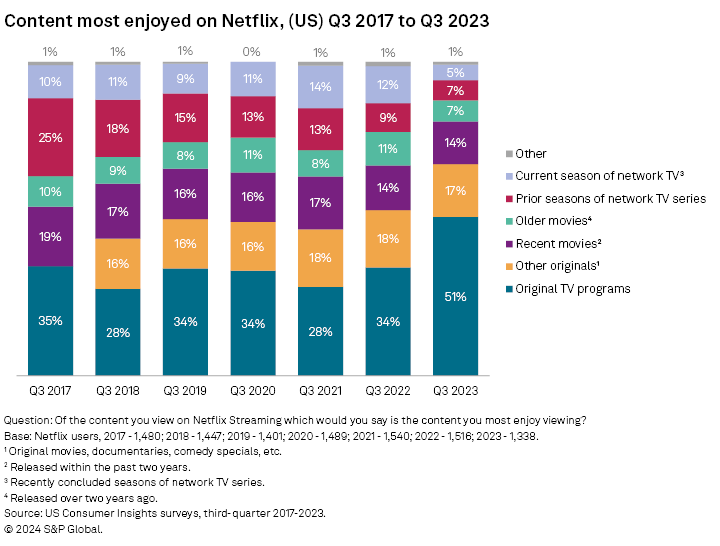
In the past, users were just as likely (if not more) to select licensed rather than originals as the content they most enjoyed on SVOD services. For Netflix Inc.'s streaming service, that dynamic shifted in favor of originals in 2022 and took another big step in 2023, when only 33% of users selected content other than originals.
Netflix
The content most enjoyed on Netflix underwent a dramatic change from 2022 to 2023, with the share of users selecting original TV programs jumping from 34% to 51%. Over the same period, current season network TV series decreased from 12% to 5%. The shift in content most enjoyed on Netflix is likely due to several factors, including the wider availability of licensed content on other services, the introduction of ads on Netflix and the crackdown on password sharing.
Hulu
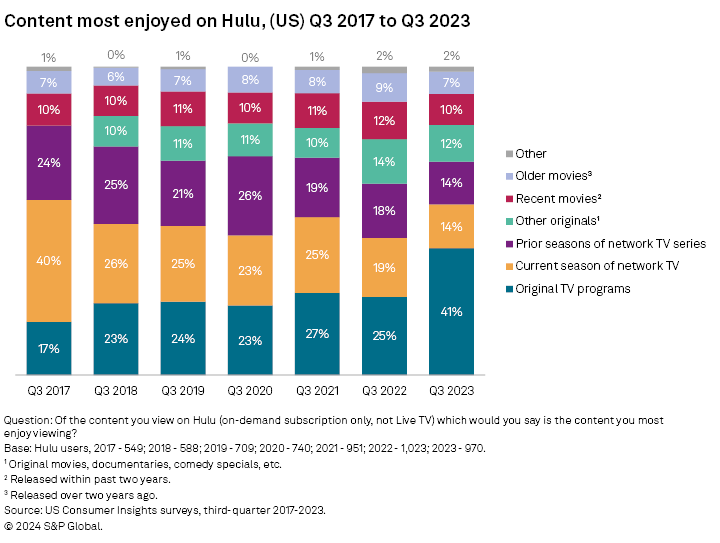
Similar to Netflix users, the share of users to Walt Disney Co.'s Hulu who selected original TV programs as the content they most enjoy on the service increased by 16 percentage points, from 25% in 2022 to 41% in the latest survey. Network TV series, including current and prior seasons, used to be more popular among Hulu users than original content. However, over time, the share of Hulu users selecting TV series as the content they most enjoy on the service decreased from a combined share of 64% in 2017 to 28% in 2023.
Prime Video
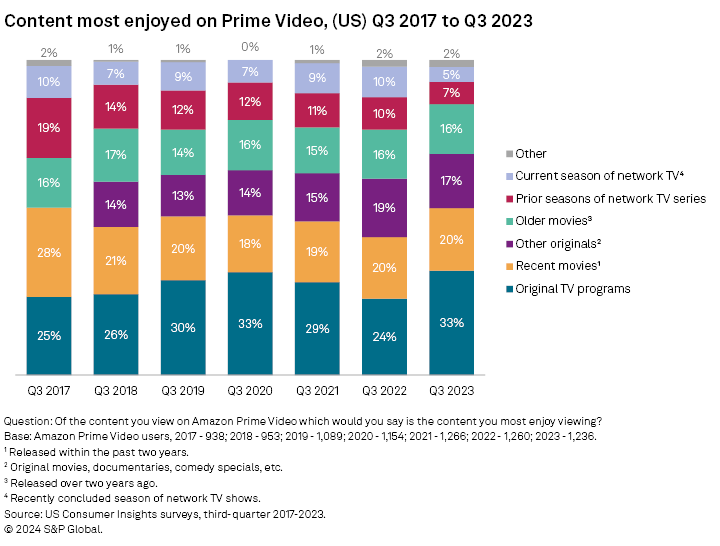
The share selecting original TV programs also increased among users of Amazon.com Inc.'s Prime Video, rising from 24% in 2022 to 33% in 2023. Original TV programs held that same share (33%) back in 2020, only to fall over the next two years. Like among Netflix users, the share of Prime Video users selecting prior seasons of network TV series has decreased over time, from a high of 19% in 2017 to 7% in 2023.
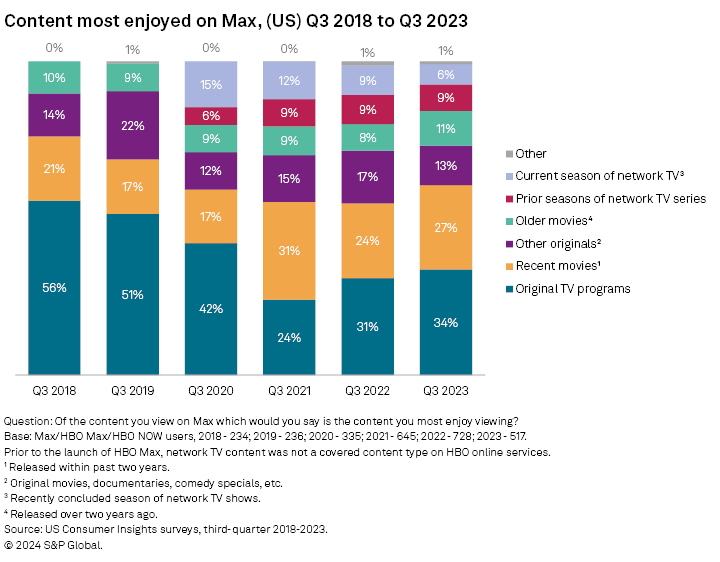
Max
In 2023, following the rebrand from HBO Max to simply Max, surveyed users selected the content they most enjoyed on the service at about the same rates as they did in 2022. Original TV programs still held the largest share at 34%, up just slightly from 31% in 2022. Recent movies also remained popular at 27%, up from 24% in 2022, although not quite as high as in 2021 when the pandemic turned many movie goers to online platforms.
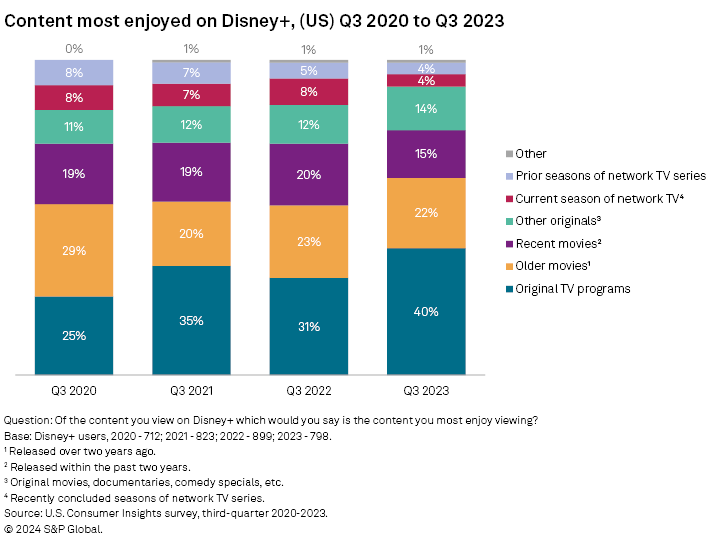
Disney+
A similar story exists among Disney+ users, with the share selecting original TV programs increasing from 31% in 2022 to 40% in 2023. Over the same period, the share of users selecting recent movies decreased from 20% to 15%, while current season network TV decreased from 8% to 4%.
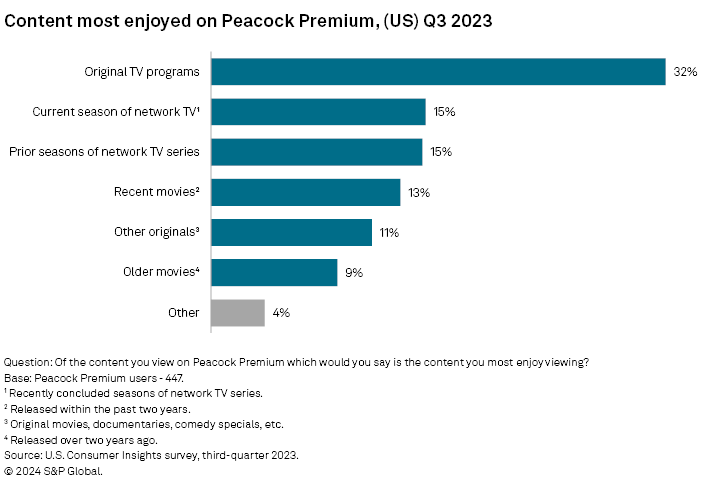
Peacock Premium
New to our 2023 survey, we also asked users of Comcast Corp.'s Peacock Premium, Paramount Global's Paramount+ and Apple Inc.'s Apple TV+ about the content they most enjoyed on the respective services. Among the users of these services, Peacock had the lowest share of users selecting original TV programs at 32%, most likely due to the service relying heavily on NBC Universal content for both back catalogue and catchup TV. Like among Hulu users, current and prior seasons of network TV follow original TV programs as the most enjoyed content on both services, at 15% each for Peacock Premium and 14% each for Hulu.
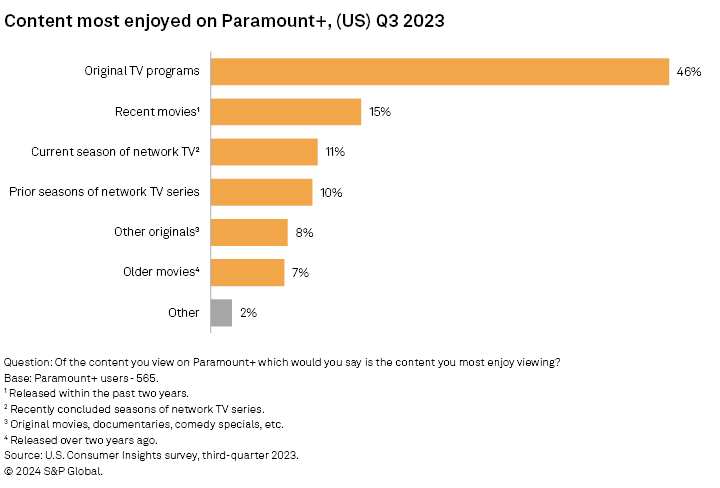
Paramount+
Since Paramount+ is similar to Peacock in that it provides a platform for the existing library of content complimented by originals, it might be expected that the content most enjoyed would also be similar. However, nearly half of Paramount+ users (46%) selected original TV programs as the content they most enjoyed on the service. Similar to Max and Prime Video users, recent movies were the second most selected content type among Paramount+ users, although only at 15%, which is lower than Prime Video at 20% and Max at 27%.
Apple TV+
Apple TV+ users were by far the most likely to select original TV programs as the content they most enjoy on the service, compared to users of the other services. However, given that the content on Apple TV+ is almost exclusively original content, 68% of users selecting original TV programs is to be expected. Recent movies was a distant second at 11%, representing the Apple produced movies, some of which land on the service following a theatrical release.
Data presented in this article is from Kagan's US Consumer Insights surveys conducted in the third quarters of 2017 through 2023. The online surveys included 2,526 (2017), 2,536 (2018), 2,531 (2019), 2,502 (2020), 2,529 (2021), 2,528 (2022) and 2,500 (2023) US internet adults matched by age and gender to the US Census. The survey results have a margin of error of +/-1.9 ppts at the 95% confidence level. Percentages are rounded to the nearest whole number.
To submit direct feedback/suggestions on the questions presented here, please use the "feedback" button located above, directly under the title of this article. Note that while all submissions will be reviewed and every attempt will be made to provide pertinent data, Kagan is unable to guarantee inclusion of specific questions in future surveys.
For more information about the terms of access to the raw data underlying this survey, please contact support.mi@spglobal.com.
Consumer Insights is a regular feature from S&P Market Intelligence Kagan.
This article was published by S&P Global Market Intelligence and not by S&P Global Ratings, which is a separately managed division of S&P Global.