
US corporations remained active in the corporate procurement arena, adding 17 GW of carbon-free generation since March 2023. This enabled pushing cumulative capacity above 93 GW, including deals signed as far back as 2008, three-quarters of which have been contracted domestically. This represents a slight decline from 2023 levels (~78%) however as more companies expand their geographic footprint.

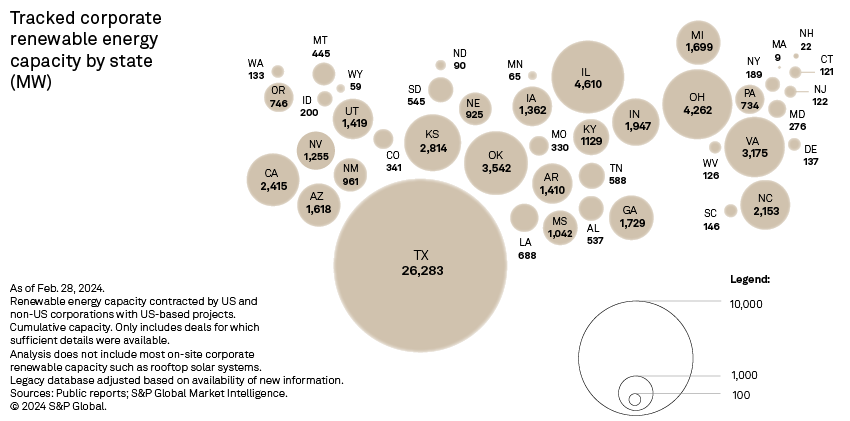
➤ US companies added 9.1 GW of renewable capacity since March 2023, according to data tracked by S&P Global Commodity Insights. Corporations once again favored the lucrative Texas market which accounted for 43% of the added capacity. Solar extended its lead in signed capacity as well, making up 81% of capacity signed in the US.
➤ Globally, US companies also remained active inking deals in five continents, with Europe leading the way. Spain was the most popular destination, with more than 2.1 GW of additional corporate capacity tracked in the 12 months since our 2023 update, half of which is allocated to Amazon.com Inc., mostly in the form of solar. Technology breakout outside the US was more evenly split between wind and solar, as solar accounted for slightly more than 50% of the clean energy deals US corporations signed internationally.

Aggregate domestic renewable capacity contracted by US-based corporations grew to 67.8 GW by the end of February 2024, with Amazon continuing to lead the way. The online retailer and cloud provider accounts for a quarter of this contracted renewable capacity tagged to US companies.
Corporations continue to ride the wave of utility-scale solar growth, as developers capitalize on low-cost solar equipment and long-term federal production and investment tax credits. Utility-scale solar capacity in development across the US jumped 24% since March 2023, reaching 286 GW. Solar accounts for just over 62% of US capacity contracted to American corporations.
Further, grid-scale battery storage capacity in development doubled over the last 12 months, reaching nearly 140 GW, with over 50 GW colocated with a wind or solar project. Complementing intermittent generation, particularly solar whose generation is constrained to daytime hours, with battery storage adds grid flexibility and revenue streams. Over 6 GW of battery capacity is currently paired with wind and solar projects that have contracted with nonutility offtakers.
Corporate procurement extended its reach to 43 US states. Texas remained the dominant market, making up 57% of the aggregate corporate renewable capacity, tracked by S&P Global Commodity Insights. Six deals of 200 MW or more were signed with Texas projects since March 2023. Dominant among them was the 250-MW agreement Amazon signed with Hecate Energy from the 514-MW Outpost Solar Project, anticipated to also have 508 MW of paired battery storage capacity. Japanese auto manufacturer Toyota Motor Corp. signed a comparable deal with the 252-MW Texas Solar Nova 1 project developed by Clearway Energy Inc.
California ranked a distant second to Texas in corporate renewable capacity added since March 2023, owing to 1 GW worth of deals signed between Amazon and AES Corp. for two 500-MW solar projects. Facebook parent company Meta Platforms Inc. and PepsiCo Inc. also signed deals in California. Utah came in third, but the state's corporate capacity came entirely from the 525-MW Faraday Solar Project, which via a green tariff with PacifiCorp is selling power to Meta. Corporate procurement deals were signed in 23 states since the 2023 update.
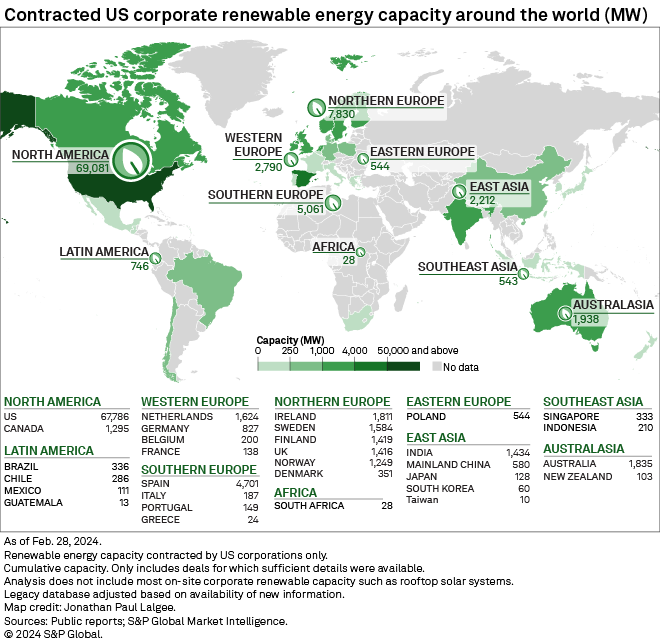
About three-quarters of the tracked corporate renewable capacity contracted internationally by US businesses was based in Europe. With some of the top offshore wind speeds in the world, Northern Europe is particularly prized. In the region, which stretches from the British Isles to the Nordics, we tracked 7.8 GW of corporate-tied renewable energy capacity — with wind accounting for 76% of this amount — accumulated by US companies.
The script was flipped across the lower, sunny latitudes of the westernmost tip of the Eurasian landmass, with photovoltaics overwhelmingly dominating, at more than 88% of the identified total. S&P Global Commodity Insights tracked a little over 5 GW of cumulative renewable energy capacity contracted by US corporations across Spain, Italy, Portugal and Greece, with 4.7 GW in Spain alone.
With Poland as its sole representative, Eastern Europe experienced the largest year-over-year increase in tracked US corporate-tied renewable energy capacity, up nearly 194% in the 12 months to our February 2024 update. The region, however, remains negligible in terms of cumulative volume, coming in at only 544 MW — a mere 2.5% of the total outside of North America.
The African continent logged the second largest jump year over year, up 180%, owing to an additional 18 MW of tracked capacity subscribed to by US commercial entities in South Africa in the 12 months through our latest two corporate renewables studies. Australasia, which offers abundant solar and wind resources, rounded out the top three in terms of year-over-year growth, up almost 125%, but at much higher orders of magnitude, with the region cumulatively closing in on the 2-GW mark as of February 2024.
Of note, our regional aggregates revolve around broad mapping geographies, not specific economic areas such as the EU, the Association of Southeast Asian Nations (ASEAN) or other legal entities. For our European breakouts, all France-based tracked capacity was rolled into Western Europe for simplicity.
Emma-xie He contributed to this article
Data visualizations by Chris Allen Villanueva and Jonathan Paul Lalgee
For wholesale prices and supply and demand projections, see the S&P Global Market Intelligence Power Forecast.
This article was published by S&P Global Market Intelligence and not by S&P Global Ratings, which is a separately managed division of S&P Global.