
Introduction
Commercial auto consistently ranked as one of the U.S. property and casualty industry's worst-performing lines prior to the pandemic, but recent results suggest that the tide has at least temporarily turned.

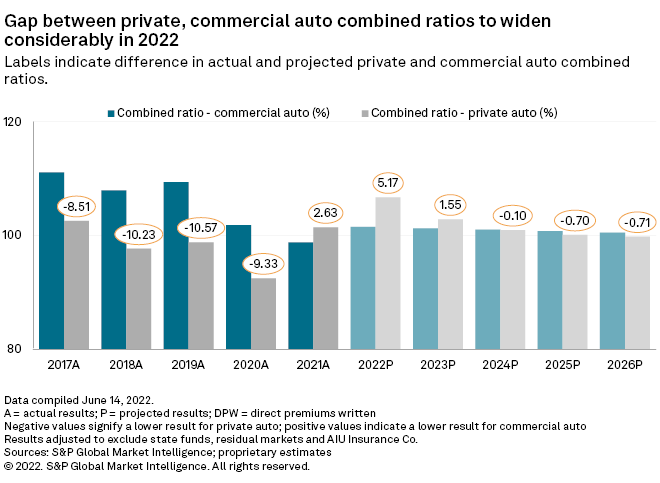
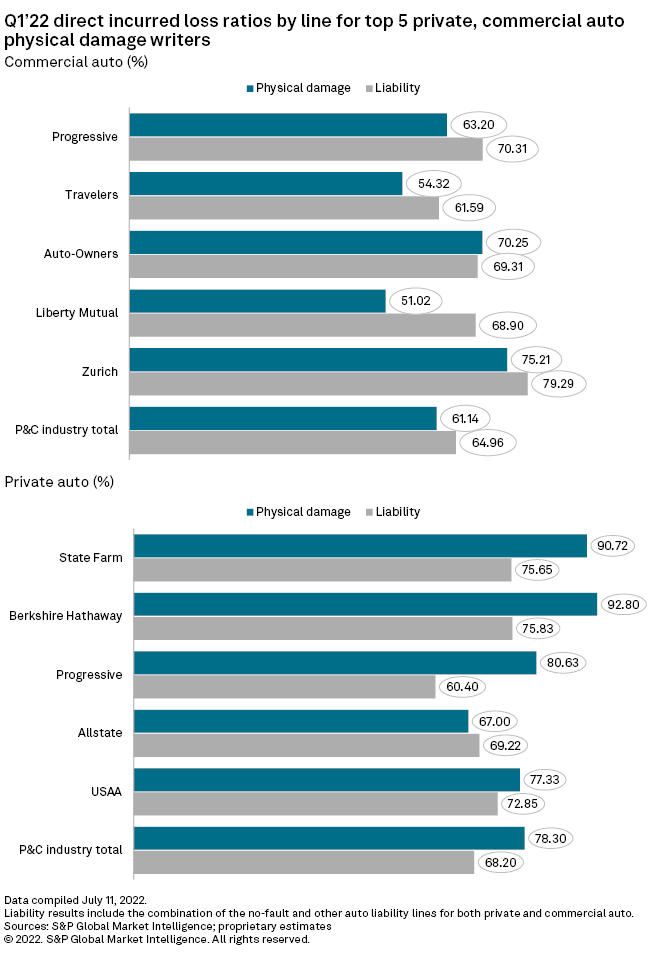
In full year 2021, the commercial auto business produced its first sub-100% combined ratio since 2010 in a year private-passenger auto results rapidly deteriorated amid rising inflationary pressures. The business line's outperformance relative to private auto persisted in the first quarter of 2022 as the commercial auto direct incurred loss ratio of 64.1%, according to an analysis of disclosures in quarterly statutory filings, was 8.3 percentage points lower than that for private auto, including a gap of 17.2 percentage points in the physical damage coverages.
Our five-year outlook, as recently released in the 2022 U.S. Property & Casualty Insurance Market Report, contemplates combined ratios of 101.5% in commercial auto and 106.7% in private auto in 2022. While we project convergence in those results during 2023 and 2024 as private auto insurers aggressively pursue rate increases to address the effects of loss-cost inflation, that spread would rank as the largest in favor of commercial auto in at least 25 years.

Driving in opposite directions
The physical damage coverages, which include those that have been most impacted by automotive supply chain-driven inflationary pressures, account for a far larger share of the overall private auto business than commercial auto.
Only 21.0% of total commercial auto direct premiums written in the first quarter rose from the physical damage coverages as compared with 41.8% in private auto. Physical damage coverages have accounted for a slowly shrinking share of total commercial auto business volume over the past decade while they have represented an incrementally higher percentage of total private auto volume. A further divergence might be in the offing in the near term as private auto insurers have been particularly aggressive in directing large rate increases to the collision and comprehensive coverages, which are part of the physical damage line.
Car and light truck repair and replacement costs have soared due directly and indirectly to supply chain disruptions, causing an increase in average collision claims severity. At the same time, a spike in catalytic converter thefts and adverse weather have contributed to a significant deterioration in results for the comprehensive coverage, another part of the private auto physical damage business that is experiencing significant upward rate movement.
It had been the commercial auto liability line that produced some of the highest combined ratios in the entire P&C industry during the 2010s, including results in excess of 113% in 2016 and 2017. As recently as 2020, the commercial auto liability combined ratio totaled 107.2%. This compares with a peak private auto liability combined ratio during the same decade of 109.5% in 2016. And, due largely to an unprecedented decline in driving during the depths of the pandemic, the private auto liability combined ratio plunged to 94.8% in 2020.
Even in 2021, the commercial auto liability combined ratio exceeded 101.4%, and it was the physical damage line, where the industry's combined ratio was only 90.2%, that led to better-than-breakeven results for the business as a whole. The 2021 commercial auto combined ratio of 98.8% across lines represented an improvement of 3.0 percentage points from 2020. It was the industry's best result since 2010 when a combined ratio of 98.1% capped an eight-year streak of underwriting profitability in the commercial auto business.
A deeper dive into that calendar-year 2021 result finds that fallout from accident-year 2020 played a significant role in the commercial auto liability improvement. The industry experienced total adverse development of incurred net losses and defense-and-cost-containment expenses, or DCCE, of $701.0 million across all accident years in calendar year 2021. This marked the lowest amount of unfavorable development since 2012. Favorable development of $425.3 million for accident-year 2020 partially offset adverse development of $1.13 billion attributable to all prior accident years.
The group led by Auto-Owners Insurance Co. Inc., alone, had $121.3 million in favorable commercial auto liability development for accident-year 2020, according to its combined annual statement, with W. R. Berkley Corp., the group led by Federated Mutual Insurance Co., and The Travelers Cos. Inc. showing respective amounts of $91.4 million, $49.8 million and $43.6 million.
Carriers have generally remained cautious about the commercial auto liability business given the potential for social inflation, which typically is defined as the rising frequency of more severe legal settlements and jury verdicts, to negatively impact underwriting results in a manner akin to the late 2010s.
Headlines about so-called nuclear jury verdicts against trucking company defendants and concerns about the potential for the clearing of a pandemic-induced backlog in court dockets continue to give the industry pause. Now, even some private auto carriers, such as Interinsurance Exchange of the Automobile Club in a new California rate filing, have begun to warn about the effects of social inflation in that business as a recent proliferation of more severe crashes has driven a spike in motor vehicle fatalities. This is likely to drive a higher percentage of claims with attorney involvement, which tends to be costlier for insurers.
For the first quarter of 2022, the commercial and private auto liability direct incurred loss ratios compared unfavorably to the year-earlier period. While the level of deterioration in the private auto liability business exceeded that in commercial auto liability, neither of the ratios carried the same sort of historical significance as the private auto physical damage result. The 78.3% private auto physical damage direct incurred loss ratio likely stands among the industry's worst results on record, though we are unable to determine its exact position in a historical context due to a recent change in reporting.
The direction that the U.S. economy takes from here represents a key variable to our overall P&C industry outlook, but we do not expect that a prospective downturn would derail efforts by private auto insurers to pursue broad-based rate increases. A recession's prospective impact on top-line growth in commercial auto would be a different story as premium writings in that business have historically been dependent upon macroeconomic circumstances. The largest decline in commercial auto direct premiums written in the last 25 years, a retreat of 9.0%, occurred in 2009 when U.S. real gross domestic product growth was a negative 2.6%.
New disclosures
However the situation unfolds, efforts by the National Association of Insurance Commissioners to promote consistency in the reporting of premiums and losses by line across annual and quarterly statements will provide more granularity into auto liability and physical damage trends, among other benefits.
Previously, the Underwriting and Investment Exhibit of annual statements and Parts 1 and 2 of quarterly statements combined commercial and private auto physical damage results into a single line. Beginning with the first quarter of 2022, line-of-business-level disclosures, including in the auto physical damage lines, will be the same across those schedules along with the state pages and the Insurance Expense Exhibit in annual statements. Similarly, the no-fault and other auto liability lines will be broken out across all statements after having previously been consolidated in some reporting schedules.
This article was published by S&P Global Market Intelligence and not by S&P Global Ratings, which is a separately managed division of S&P Global.